← Khanim Azimli PowerPoint, Rebuilt · Study 01 Editable PPTX ↓
Presentation & Data StorytellingNew series · Before → After

PowerPoint,rebuilt.

Not every presentation starts with a glamorous subject. Sometimes the challenge is simply to make complex business content clear, structured and worth looking at.

These are transformation studies showing how far an ordinary corporate deck can move through hierarchy, storytelling and native PowerPoint design.

PowerPoint transformation study · 01

From Complexity
to Control

Source material
KPMG Future of SOX webcast
February 26, 2026 · public
Format
49 source slides → 10-slide redesign
Built in
Microsoft PowerPoint, 100% editable
Type
Independent redesign exercise
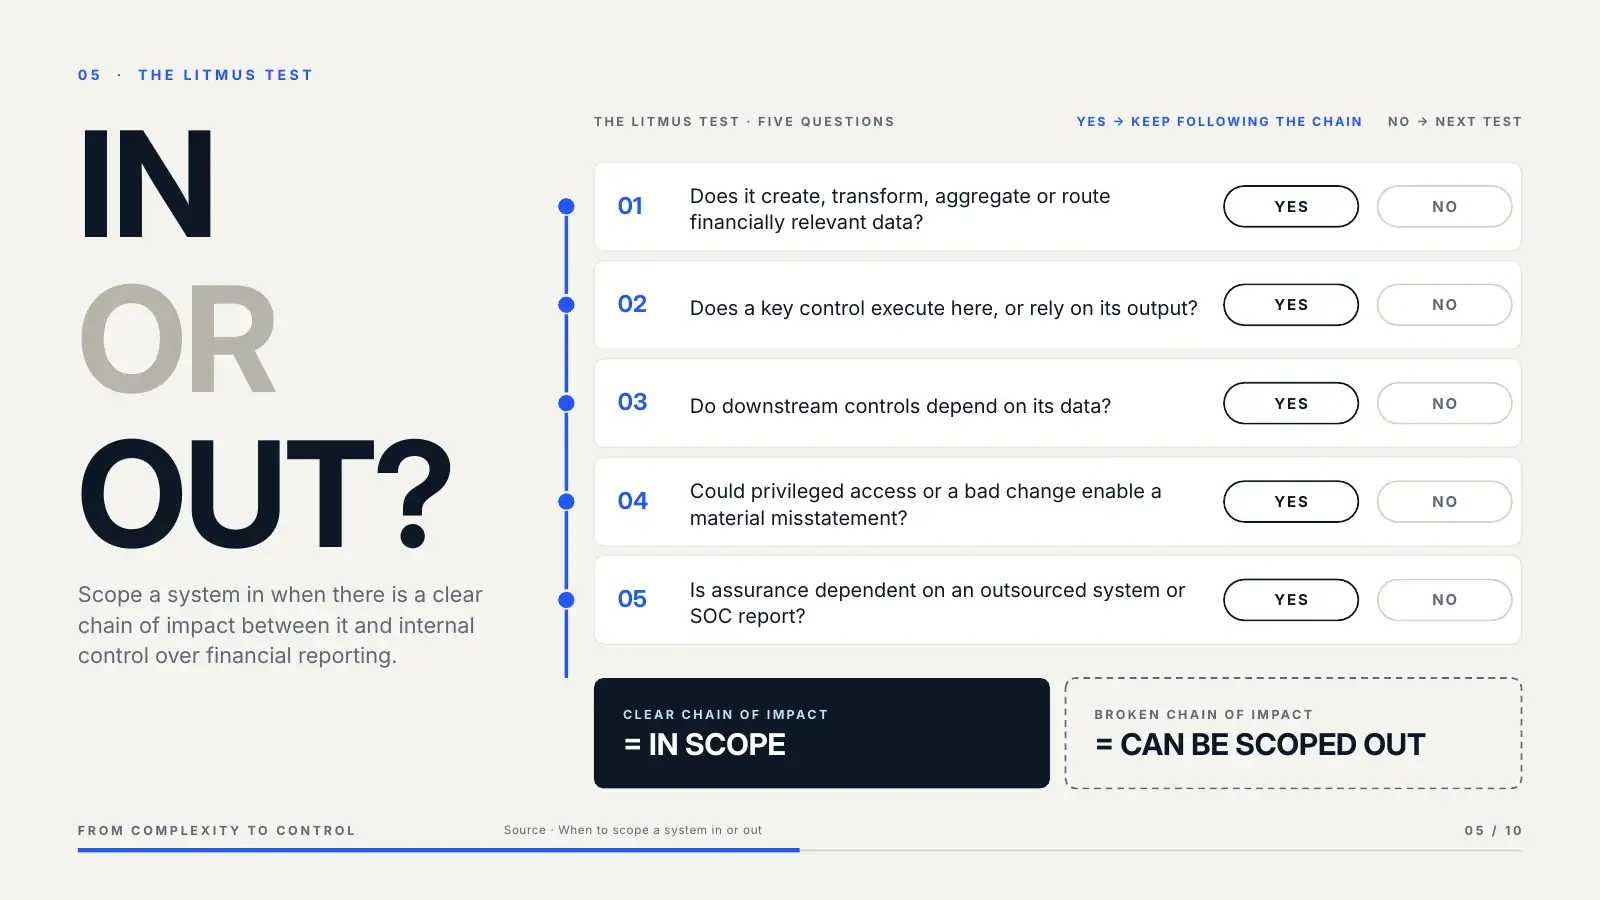
After: IN OR OUT? A five-step decision interface for scoping a system, with a chain of impact and two outcomes.
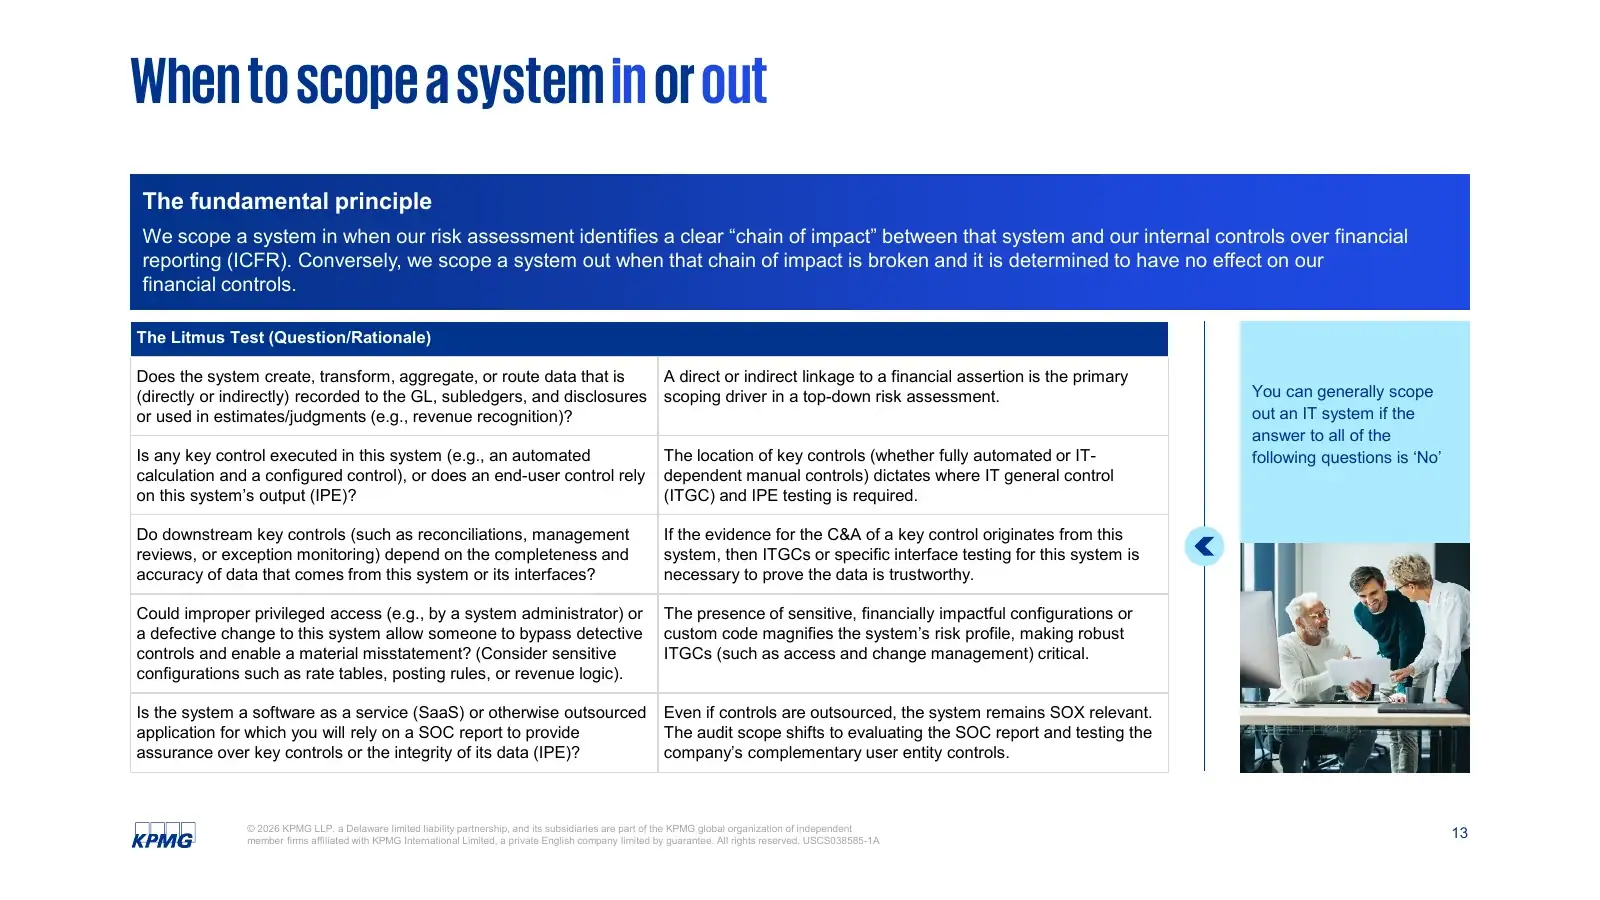
Before: original slide 13, a dense two-column litmus test table.
Before 13After 05

Drag to compare · the original is shown as published

49slides in
10slides out

Same subject.
Different experience.

A corporate deck does not need to look corporate.

For this redesign exercise, I took a dense, 49-slide SOX webcast and rebuilt its core story as a focused 10-slide PowerPoint presentation.

The challenge was not decoration. It was deciding what the audience should understand first, what could disappear, and what needed to become visual.

The entire redesign was created around native PowerPoint systems: layouts, editable diagrams, Morph transitions, animation and reusable components.

The result is still a PowerPoint.
It just works much harder.

The information was already there. The redesign focuses on hierarchy, story, clarity, pacing and visual communication.

Before → After

Five transformations

01
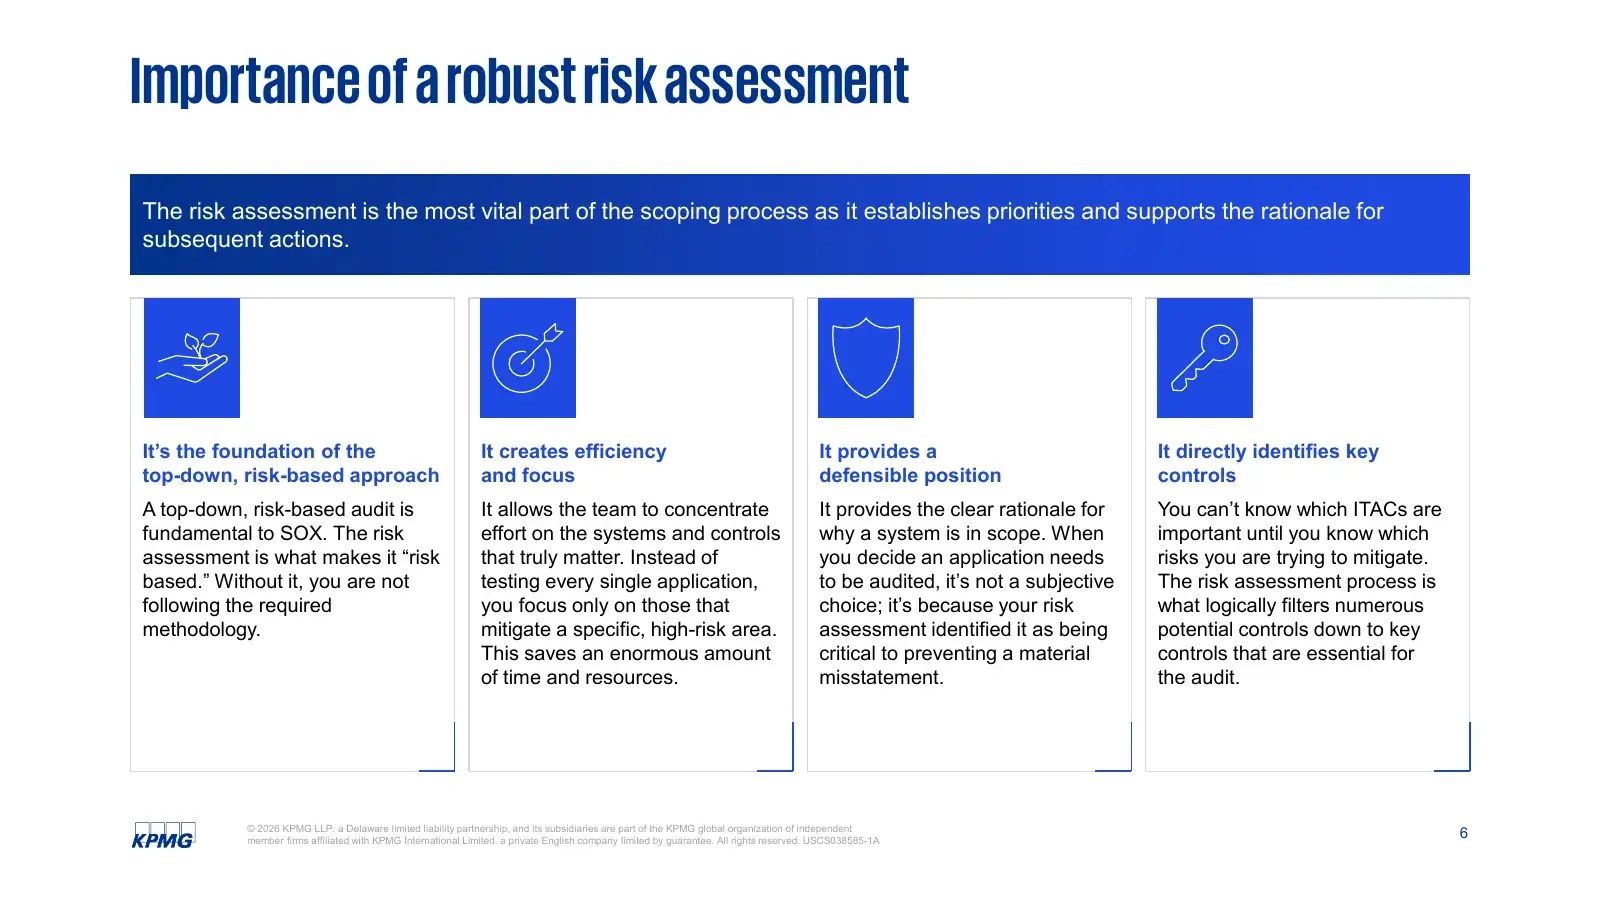
OriginalImportance of a robust risk assessment
AfterYou don’t need to control everything. You need to know what matters.
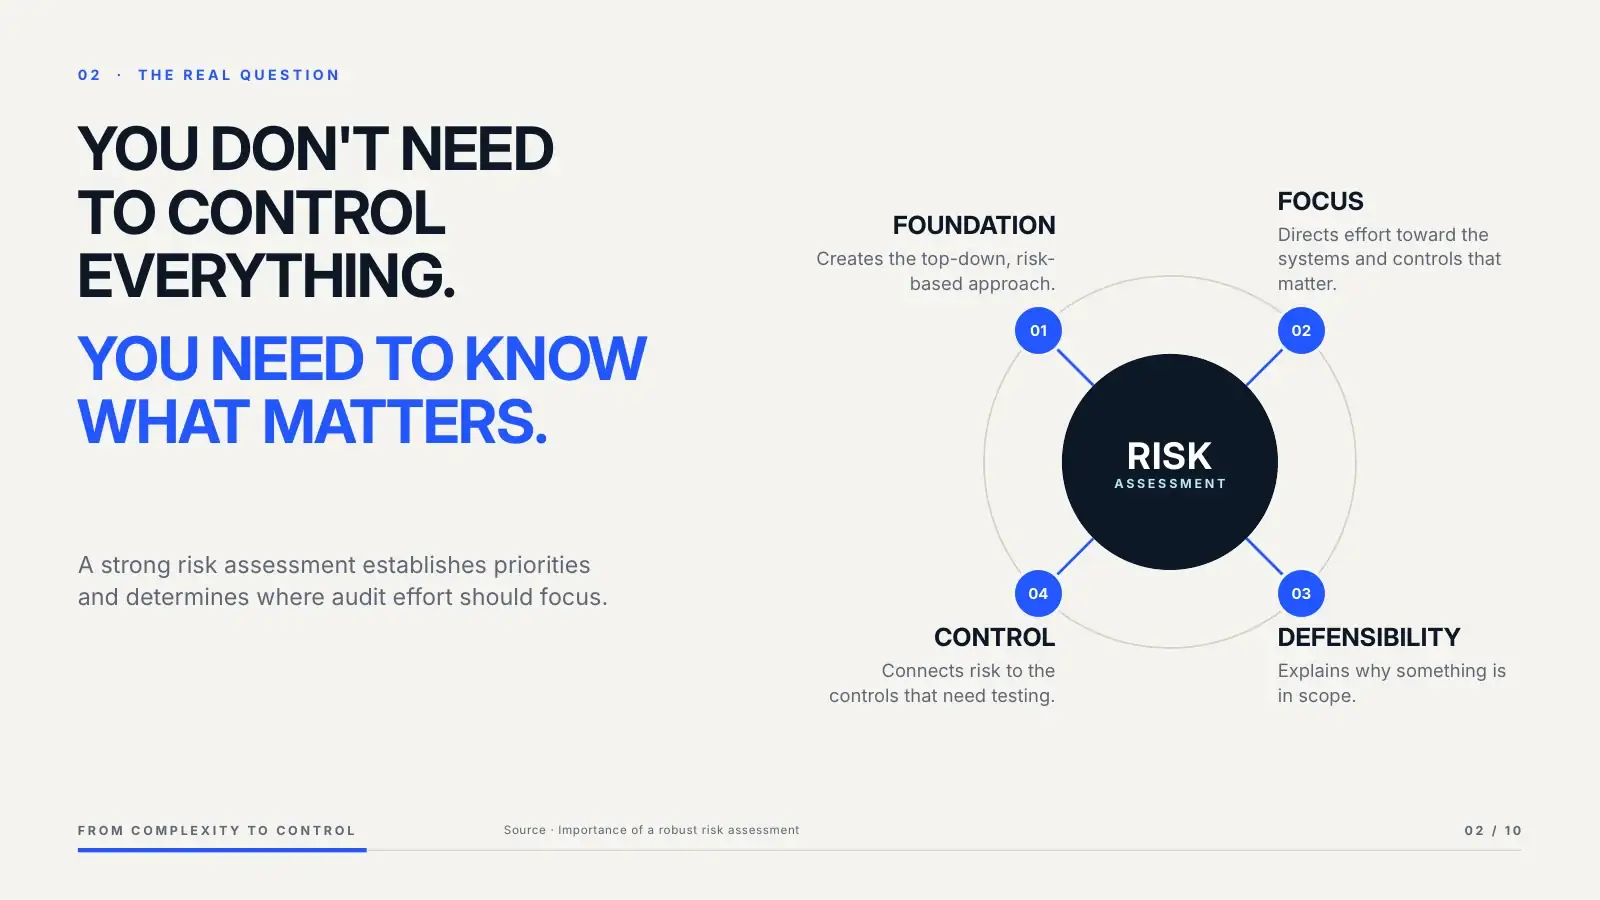
After: one central risk node with four consequences radiating from it.
Before: four equal text columns under a blue banner.
Before 06After 02

WhyA text-heavy four-column slide became one central risk system. The idea that everything depends on the risk assessment is now the layout itself.

Hierarchy
Four equal columns → one central idea
Structure
Four text cards → one radial system
Content
Paragraphs → four short consequences
Motion
Static → five-click radial build
Editability
Still 100% PowerPoint
02
OriginalWhen to scope a system in or out
AfterIn or out?
After: five sequential questions as a decision interface.
Before: the litmus test as a dense question and rationale table with a stock photo.
Before 13After 05

WhyA dense litmus-test table became a visual decision system. Each question is answered one click at a time, and the chain of impact either holds or breaks.

Hierarchy
Table title → one question
Structure
Ten-cell table → five-step interface
Content
Explanation → decision logic
Motion
Static → one test per click, Morph into the real case
Editability
Still 100% PowerPoint
03
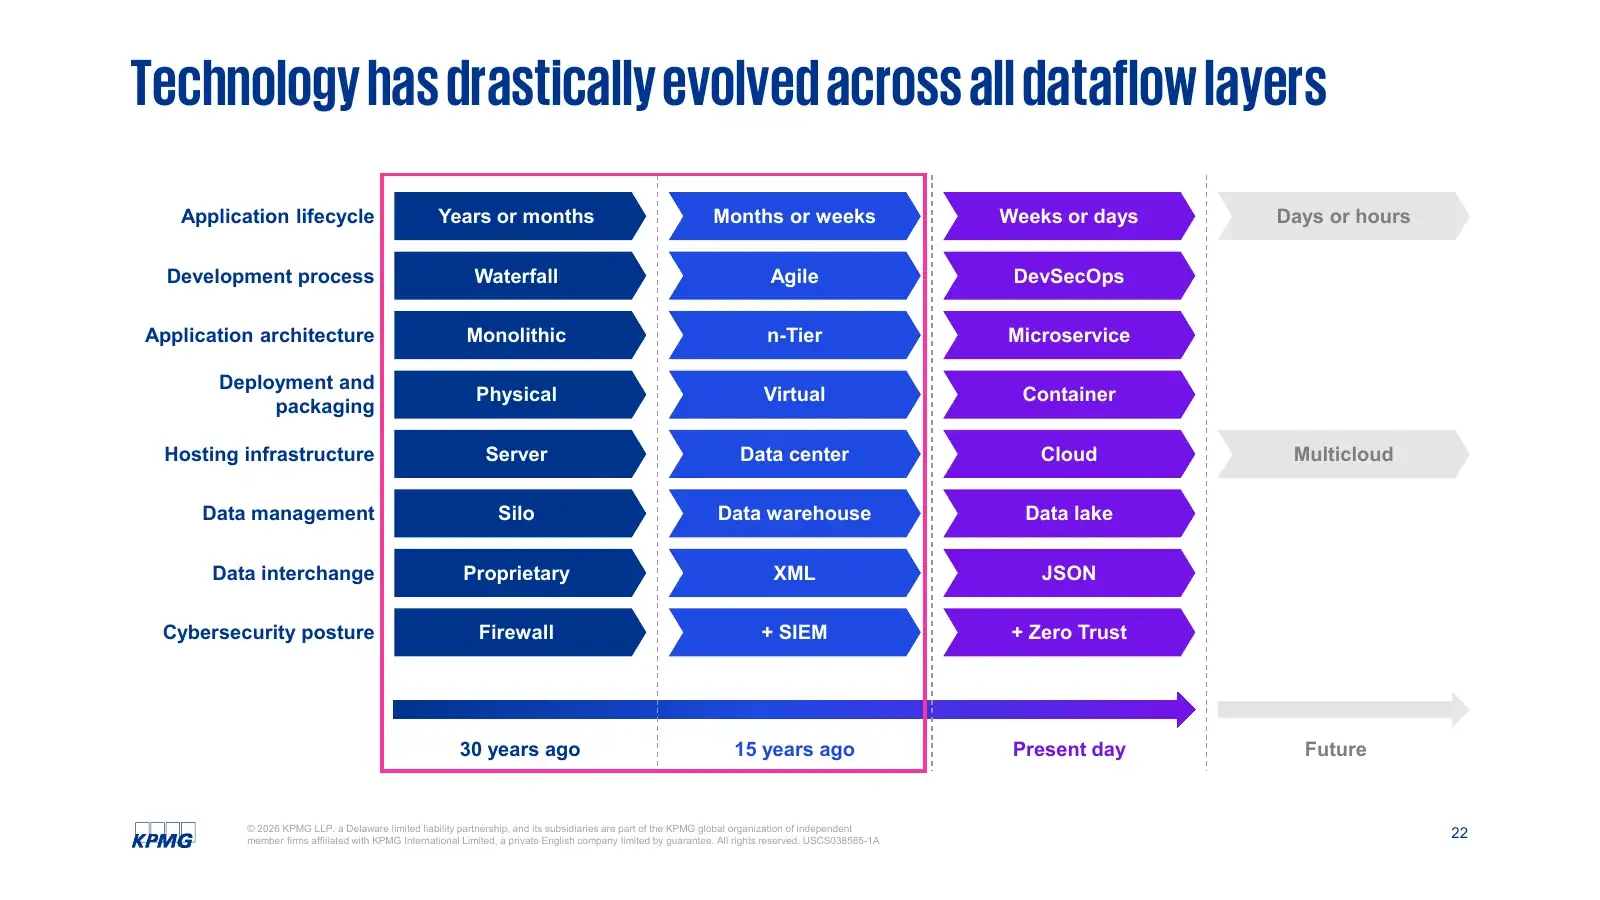
OriginalTechnology has drastically evolved across all dataflow layers
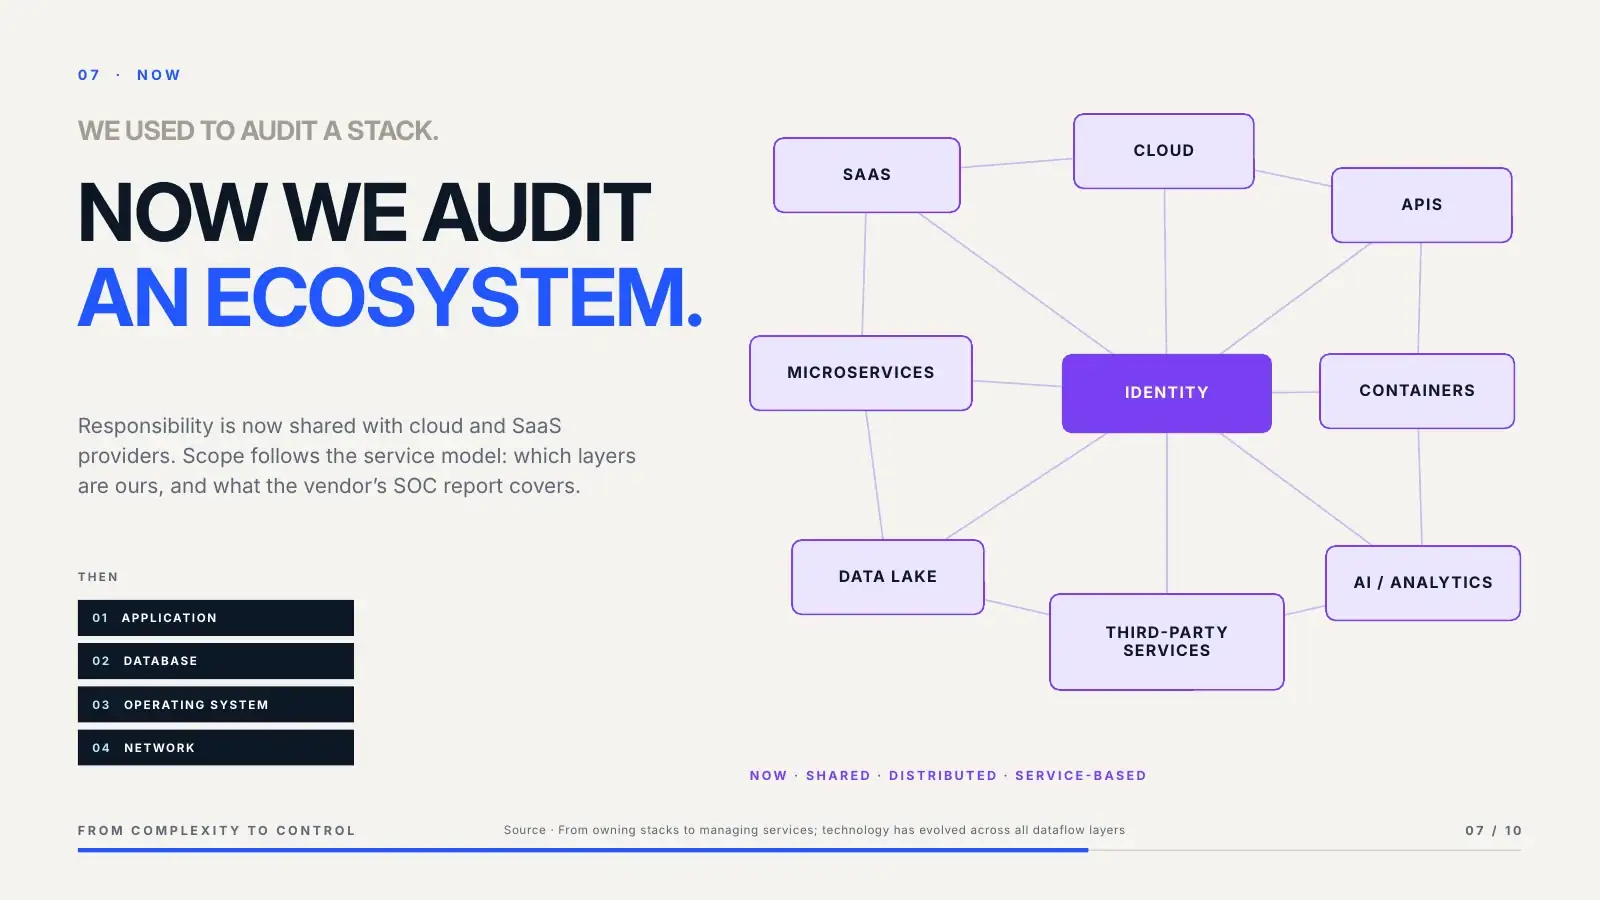
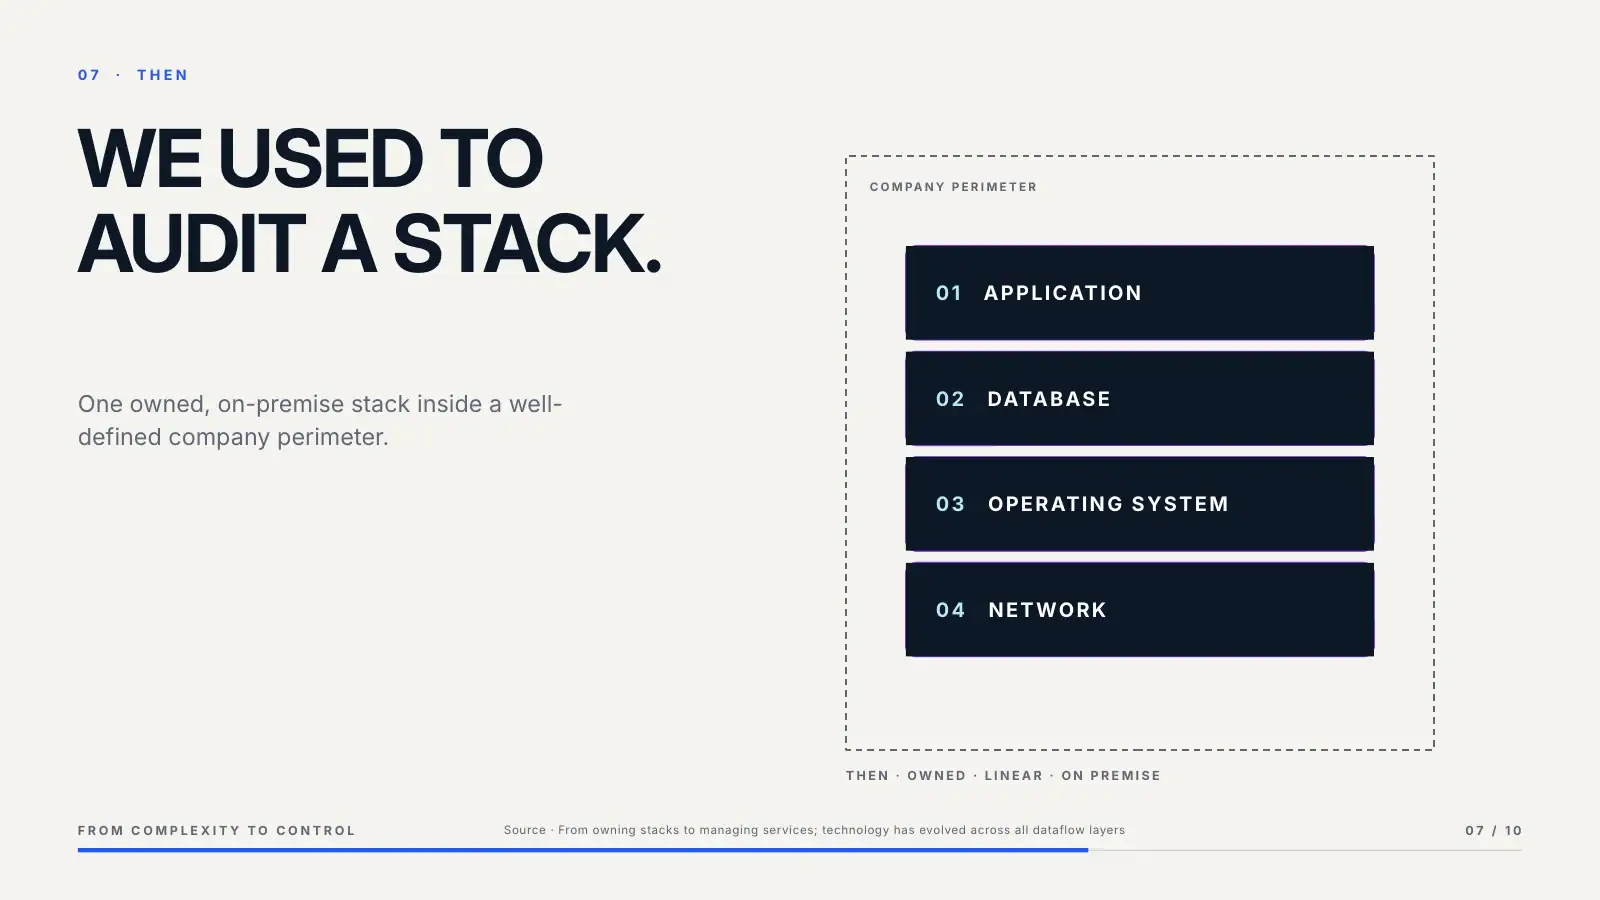
AfterWe used to audit a stack. Now we audit an ecosystem.
After: nine services connected around an identity hub, with the old four-layer stack shrunk to a footnote.
Before: an eight-row comparison matrix of technology evolution.
Before 22After 07
Morph state A: the four-layer stack inside a company perimeter.
State A · the stack
Morph→
Morph state B: the stack breaks apart into an ecosystem.
State B · the ecosystem

WhyA dense comparison matrix became a single Morph. Nine services are hidden behind the four stack layers on slide A, so on the transition the stack physically breaks apart into the ecosystem.

Hierarchy
Eight-row matrix → one contrast
Structure
Timeline grid → stack vs ecosystem
Content
Labels → a shift in responsibility
Motion
Static → Morph, the stack explodes
Editability
Still 100% PowerPoint
04
OriginalCommon challenge example + Sample solution
AfterBlack box → visible system
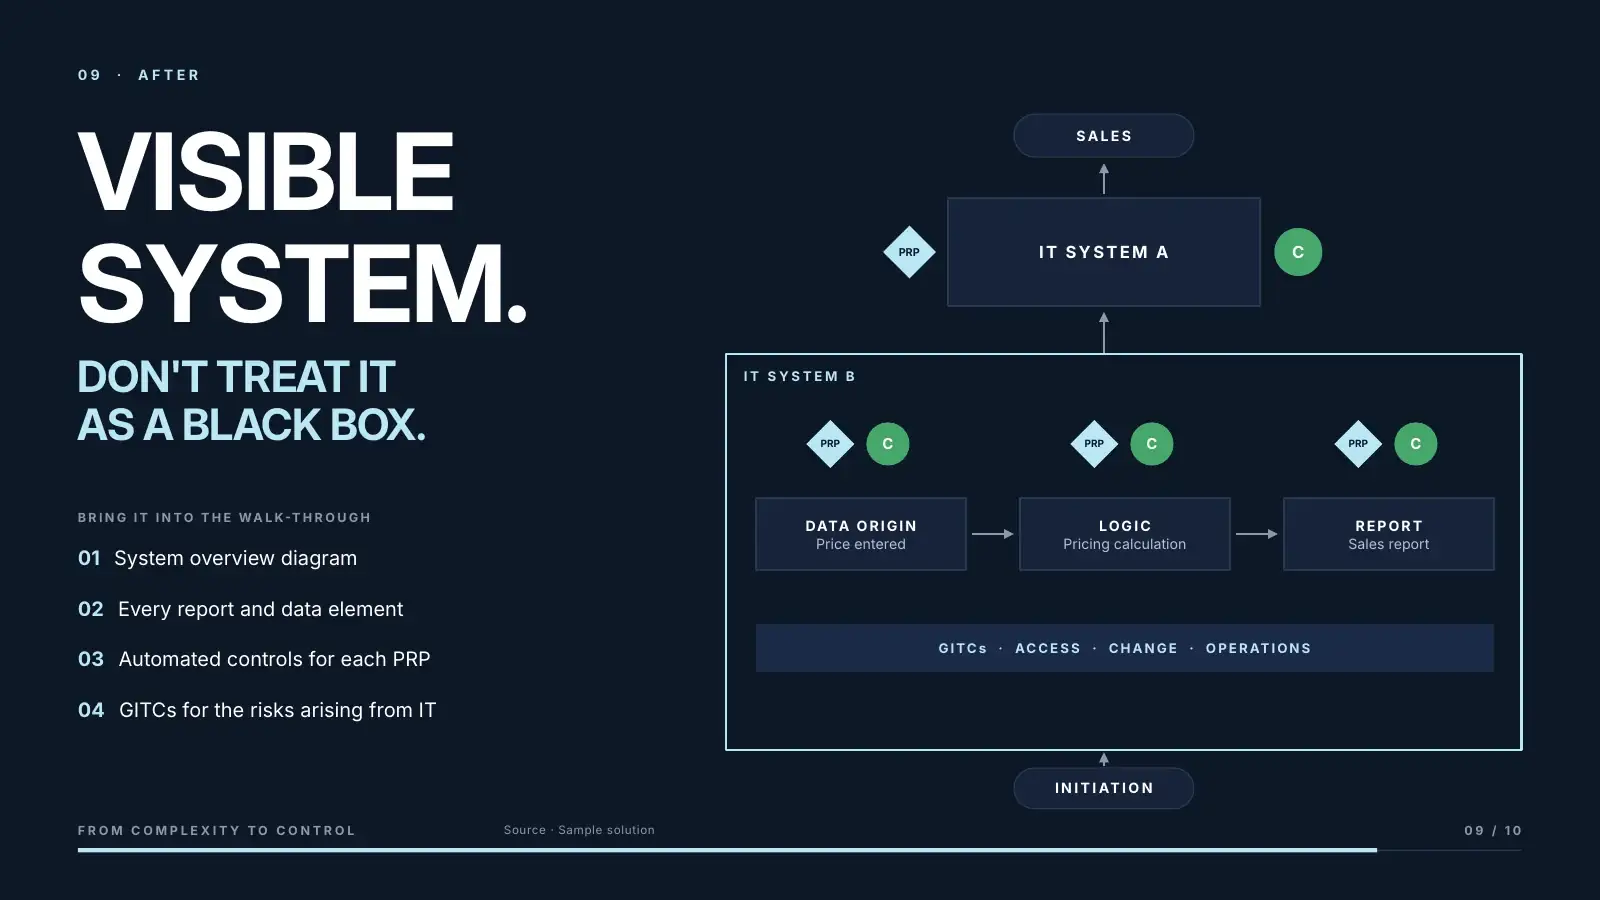
After: System B opened into a transparent map with data origin, logic, report, risk points, controls and GITCs.
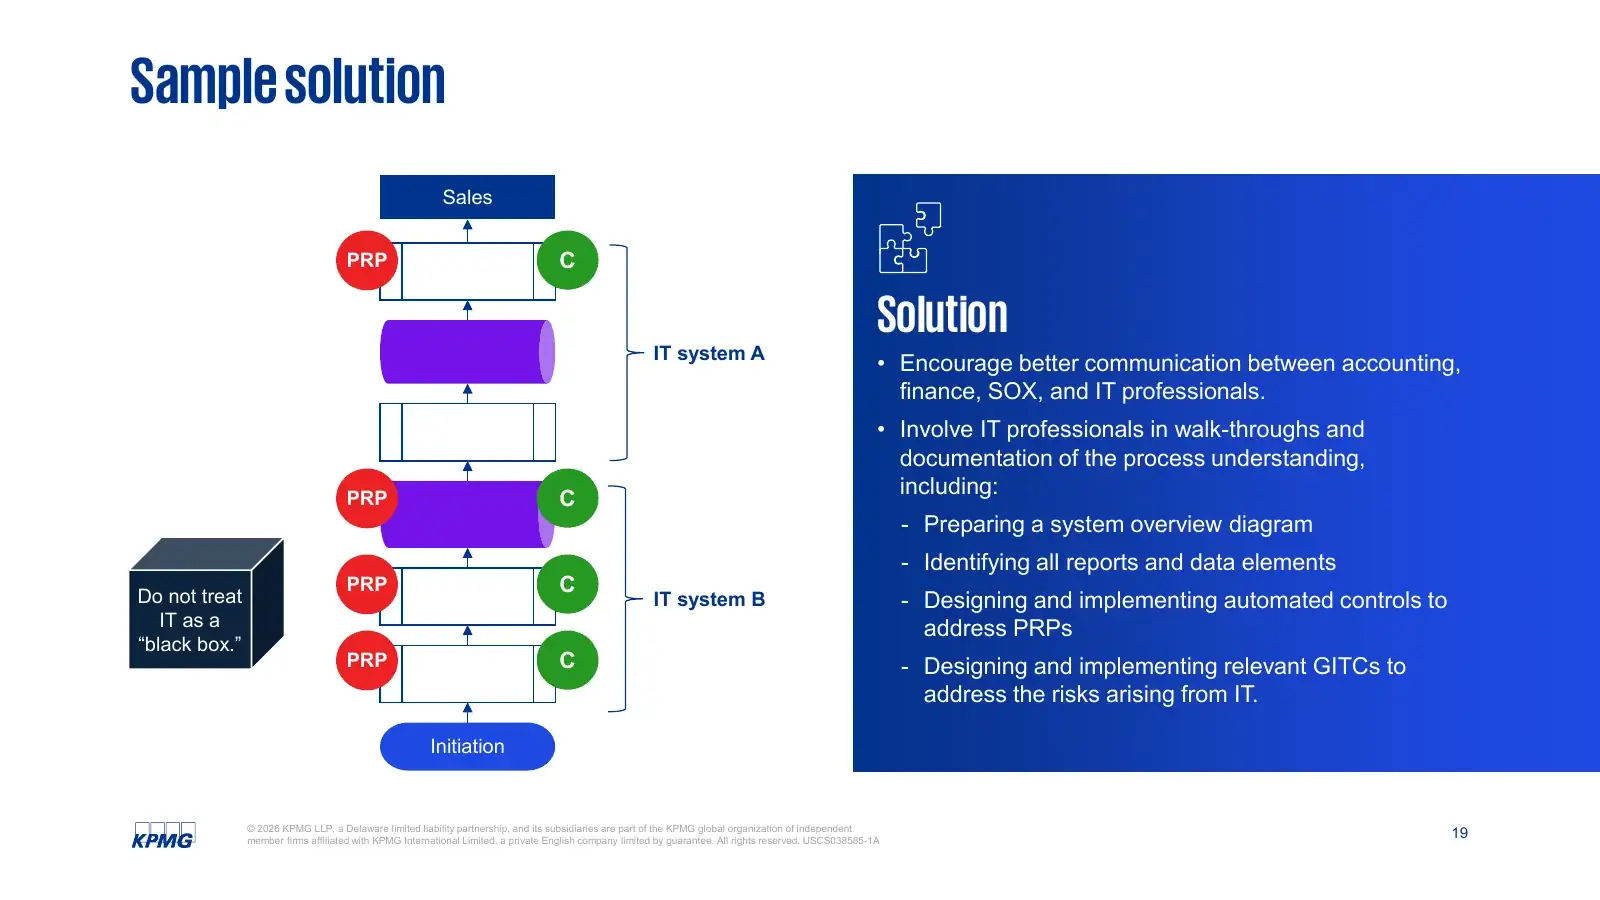
Before: the sample solution slide, a vertical process diagram next to a bullet list.
Before 19After 09
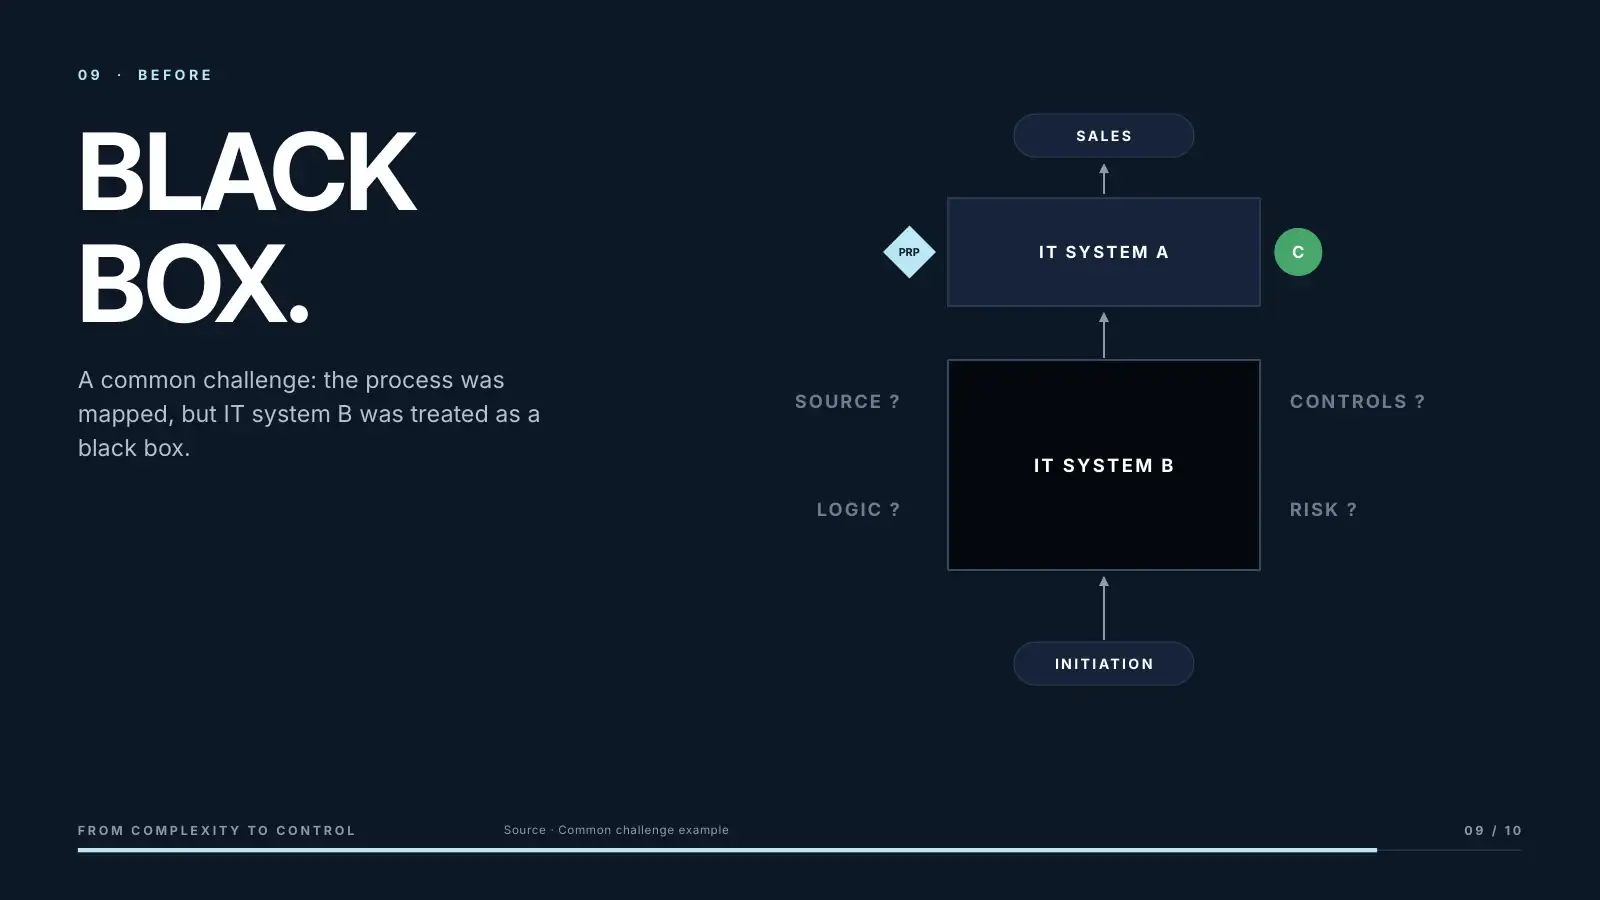
Morph state A: IT system B as an opaque black box.
State A · black box
Morph→
Morph state B: the box opens into a visible system.
State B · visible system

WhyTwo functional diagrams on two slides became one narrative transformation. The black box physically opens: its contents are already on the slide, stacked behind the box, waiting for Morph.

Hierarchy
Two slides → one thesis
Structure
Challenge + solution → one system that opens
Content
Bullet lists → what becomes visible
Motion
Static → Morph, the box opens
Editability
Still 100% PowerPoint
05
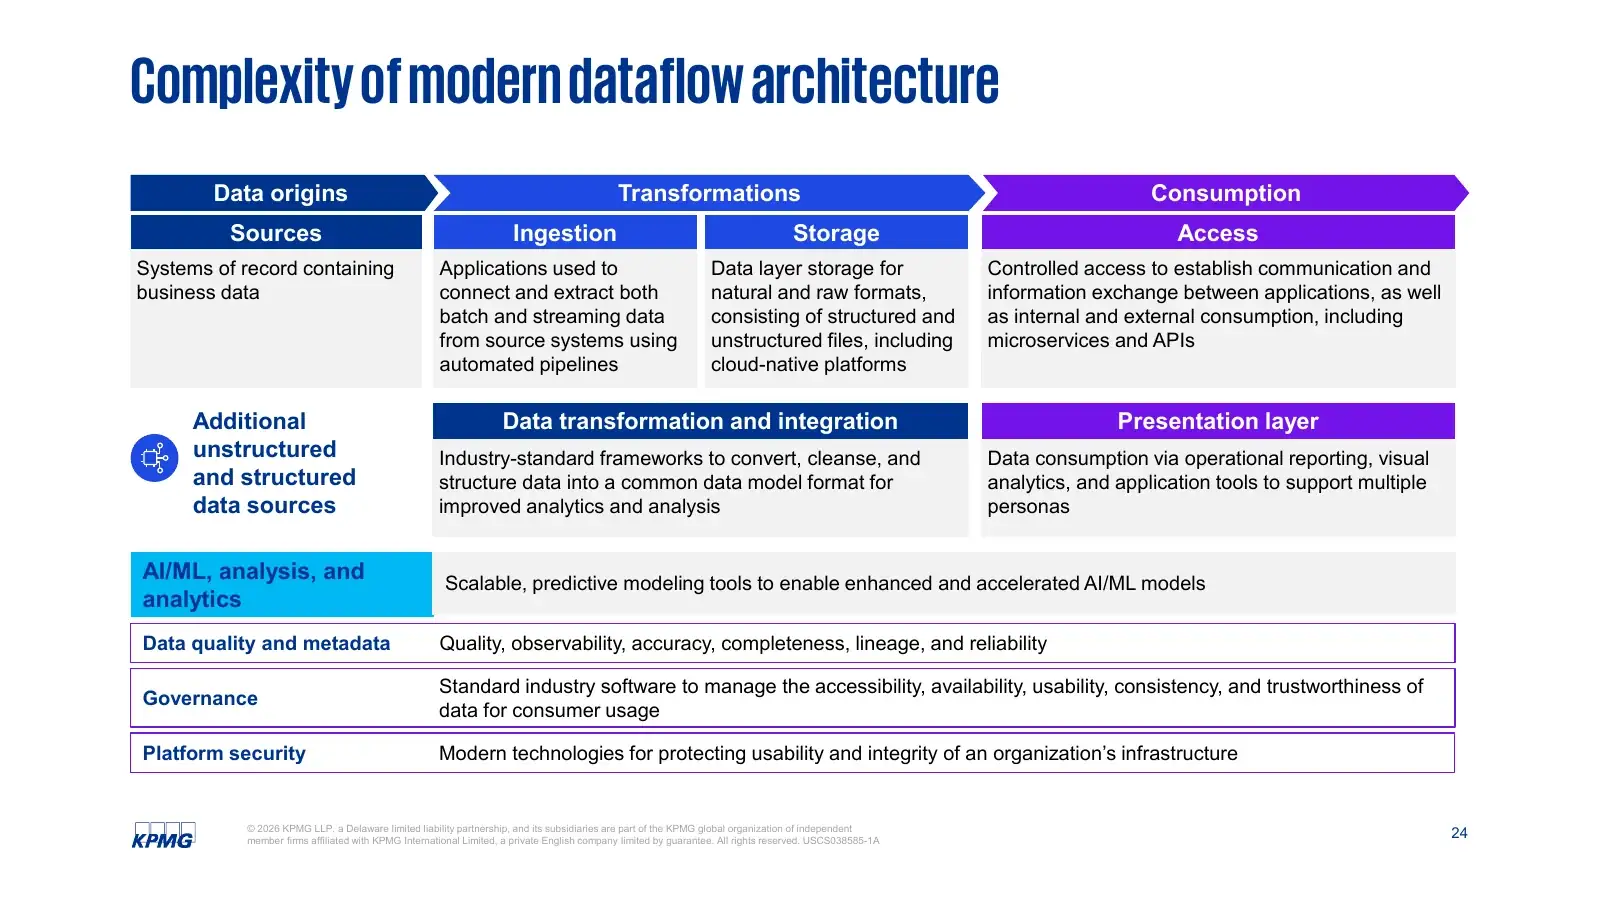
OriginalComplexity of modern dataflow architecture
AfterThe risk is in the journey.
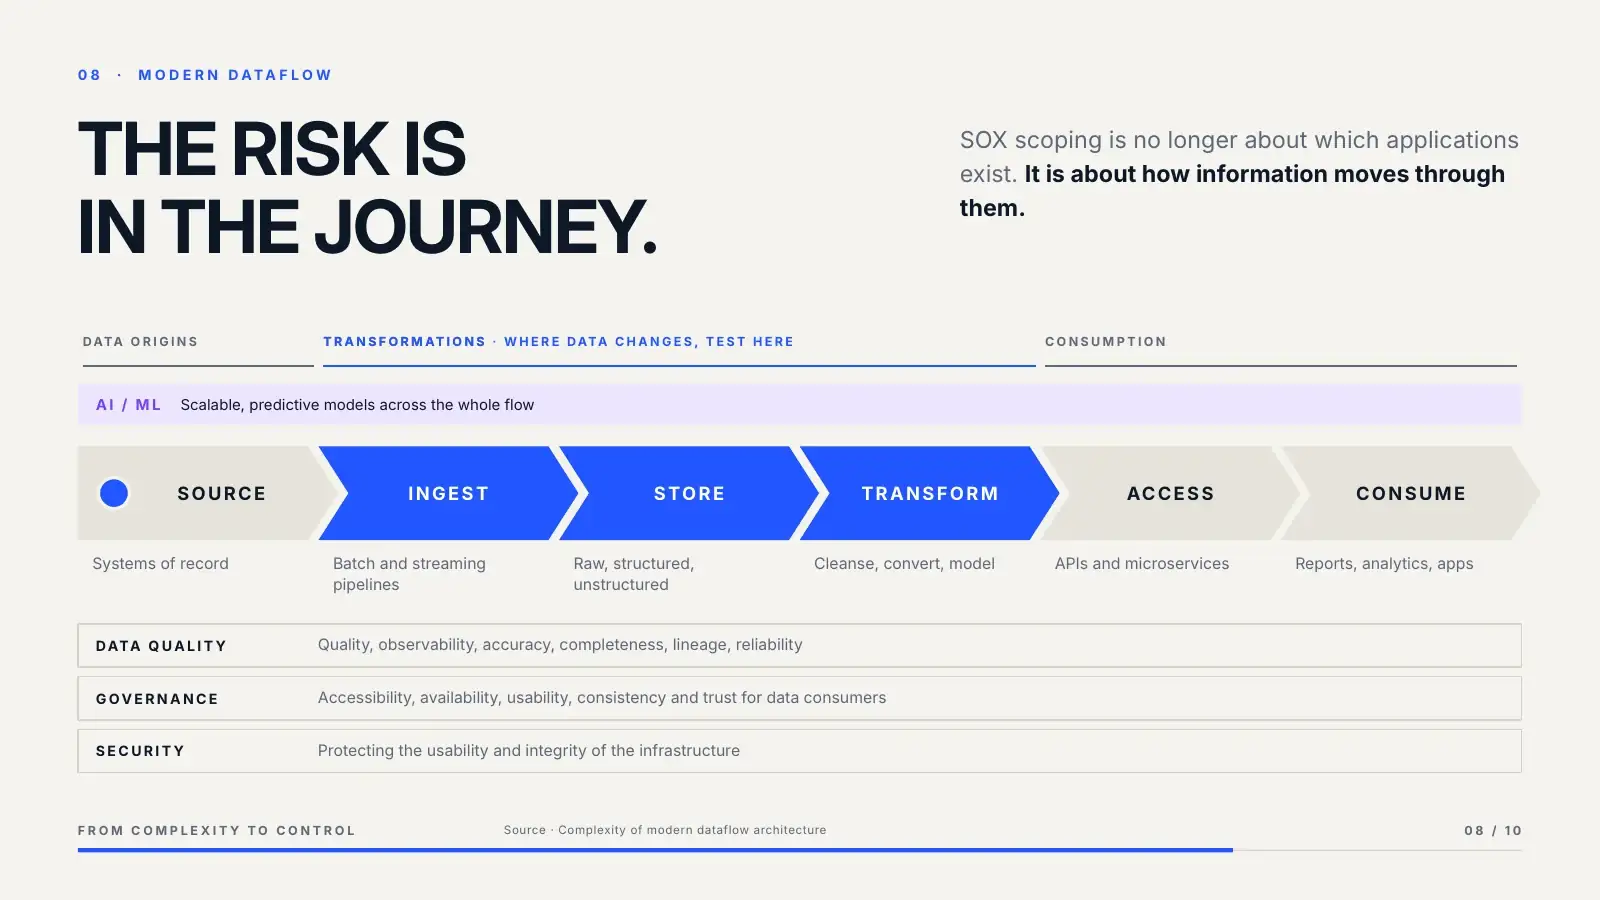
After: one horizontal flow from source to consume over persistent quality, governance and security layers.
Before: a dense architecture table of definitions.
Before 24After 08

WhyA table of definitions became one journey. A data element travels the flow on a motion path, then the three stages where data is transformed light up: that is where scoping attention goes.

Hierarchy
Architecture table → one sentence
Structure
Definition cells → one flow, three layers
Content
Definitions → where data changes
Motion
Static → data travels, risk lights up
Editability
Still 100% PowerPoint
Thinking, not beautification

What stayed, what merged, what went.

Kept as the story13

source slides carry the argument: methodology, risk assessment, process flow, the litmus test, the identity example, the black box, the changing stack and the conclusion.

Merged3

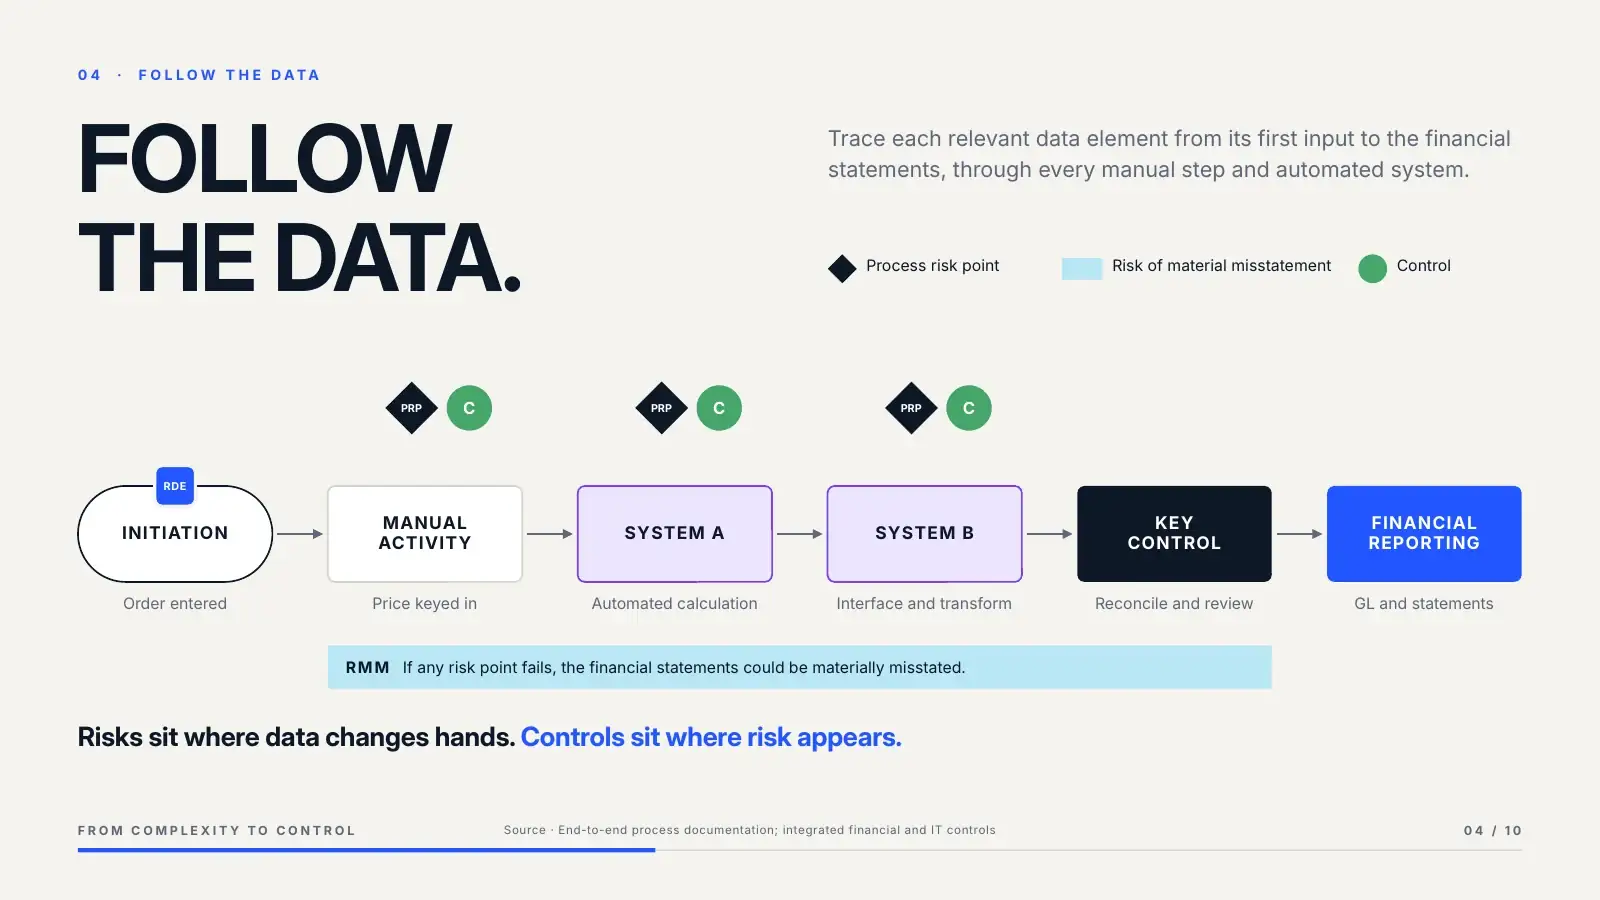
pairs became single moments: challenge + solution into one Morph, two technology slides into one, process documentation + integrated controls into one data journey.

Left out, on purpose36

agenda, speakers, dividers, legal pages and the ICFR hot topics (code review, IPE failures, agile, user access reviews). Strong content, but a different story.

10 chapters · 13 slides including 3 Morph states

The 10-slide story

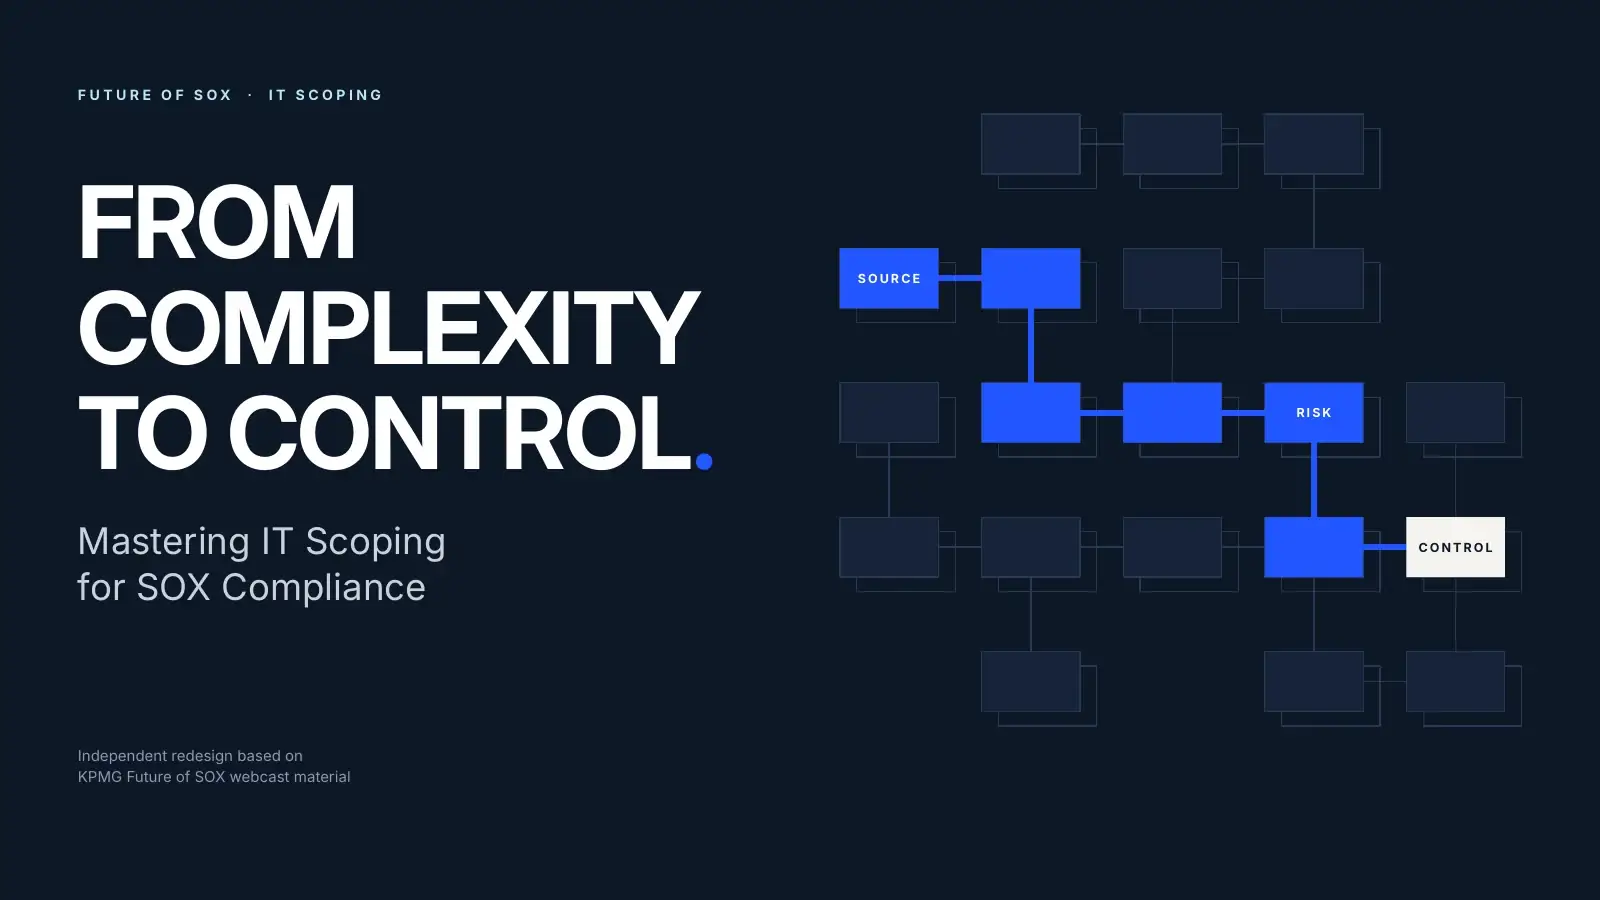
  1. 01 Cover01 · From complexity to control
  2. 02 The real question02 · The real question
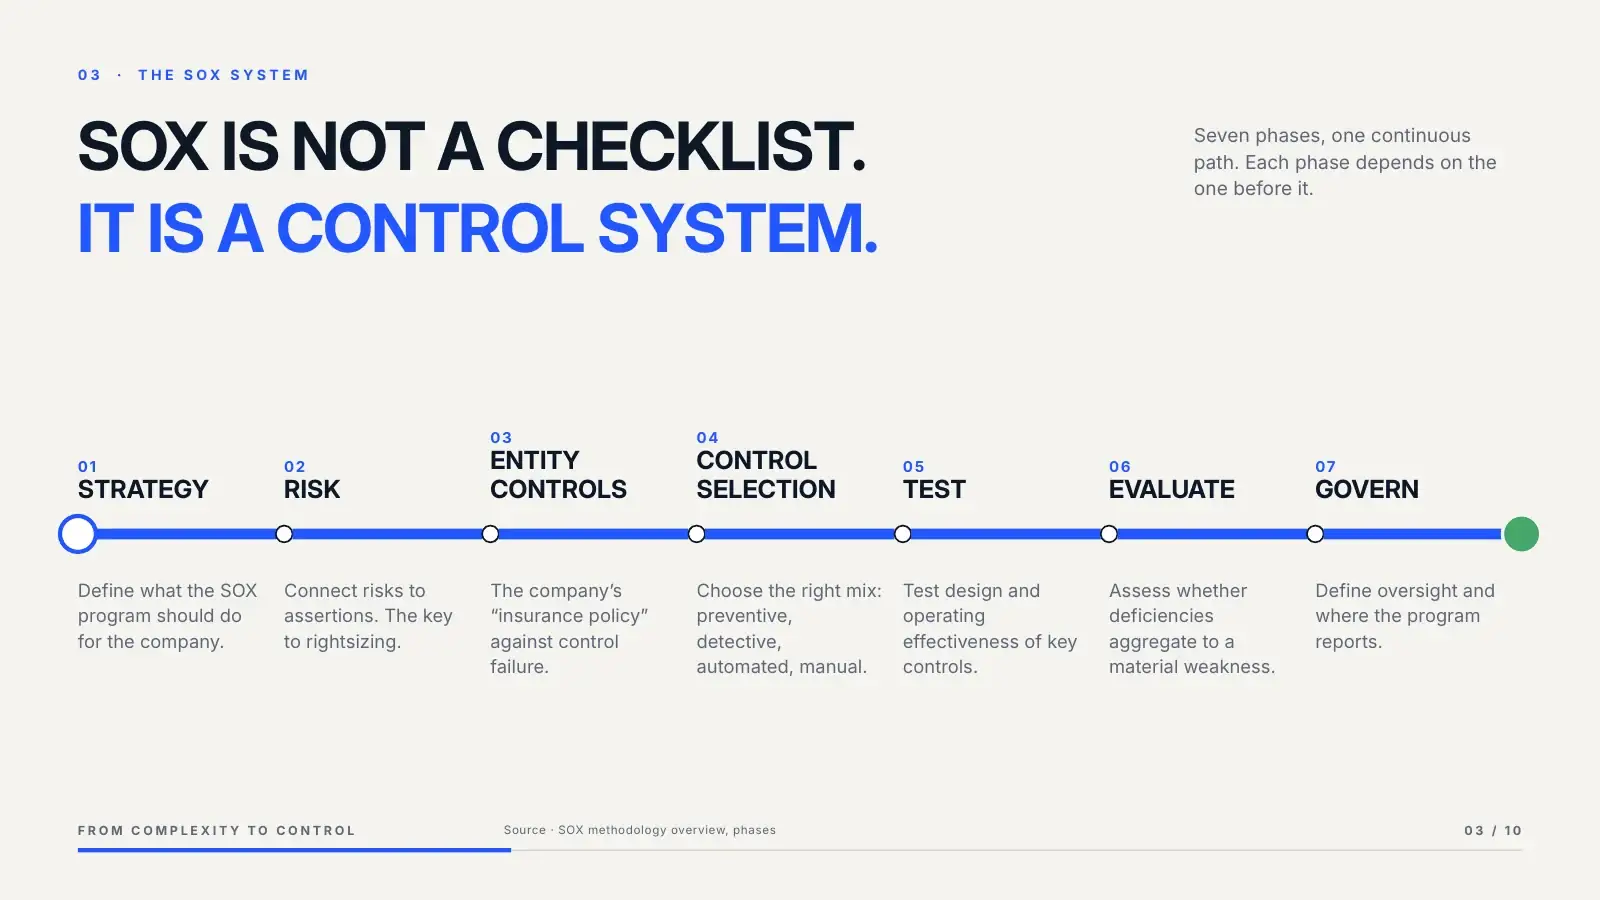
  3. 03 The SOX system03 · The SOX system
  4. 04 Follow the data04 · Follow the data
  5. 05 In or out05 · In or out?
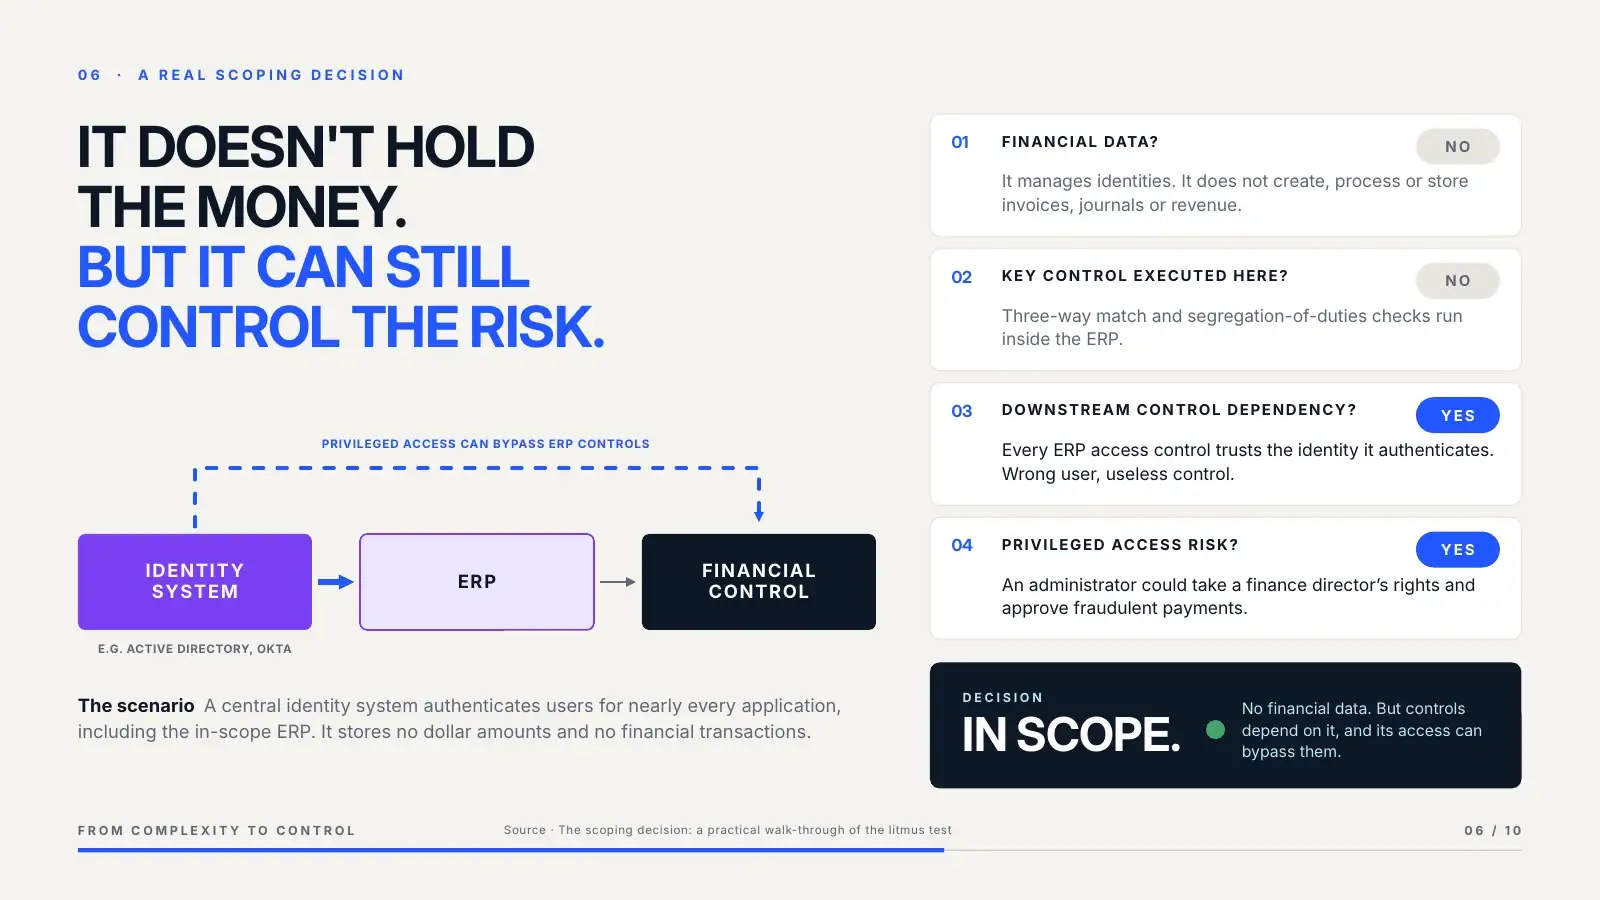
  6. 06 A real scoping decision06 · A real scoping decision
  7. 07 state A, the stack07 A · The stack
  8. 07 state B, the ecosystem07 B · The ecosystem Morph
  9. 08 The risk is in the journey08 · The risk is in the journey
  10. 09 state A, black box09 A · Black box
  11. 09 state B, visible system09 B · Visible system Morph
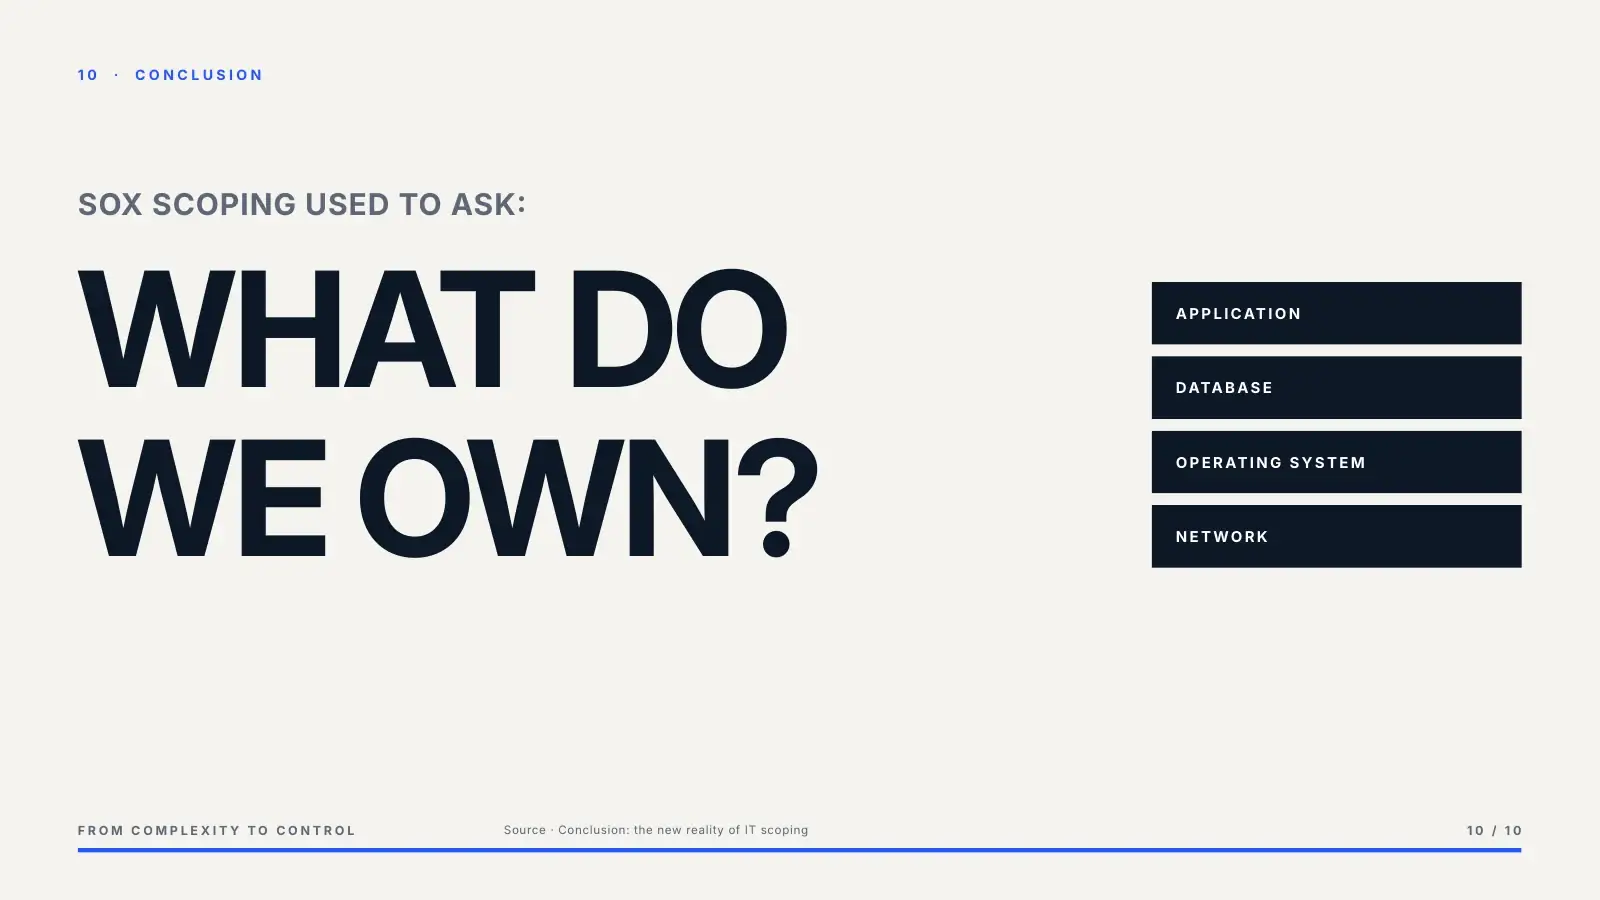
  12. 10 state A, what do we own10 A · What do we own?
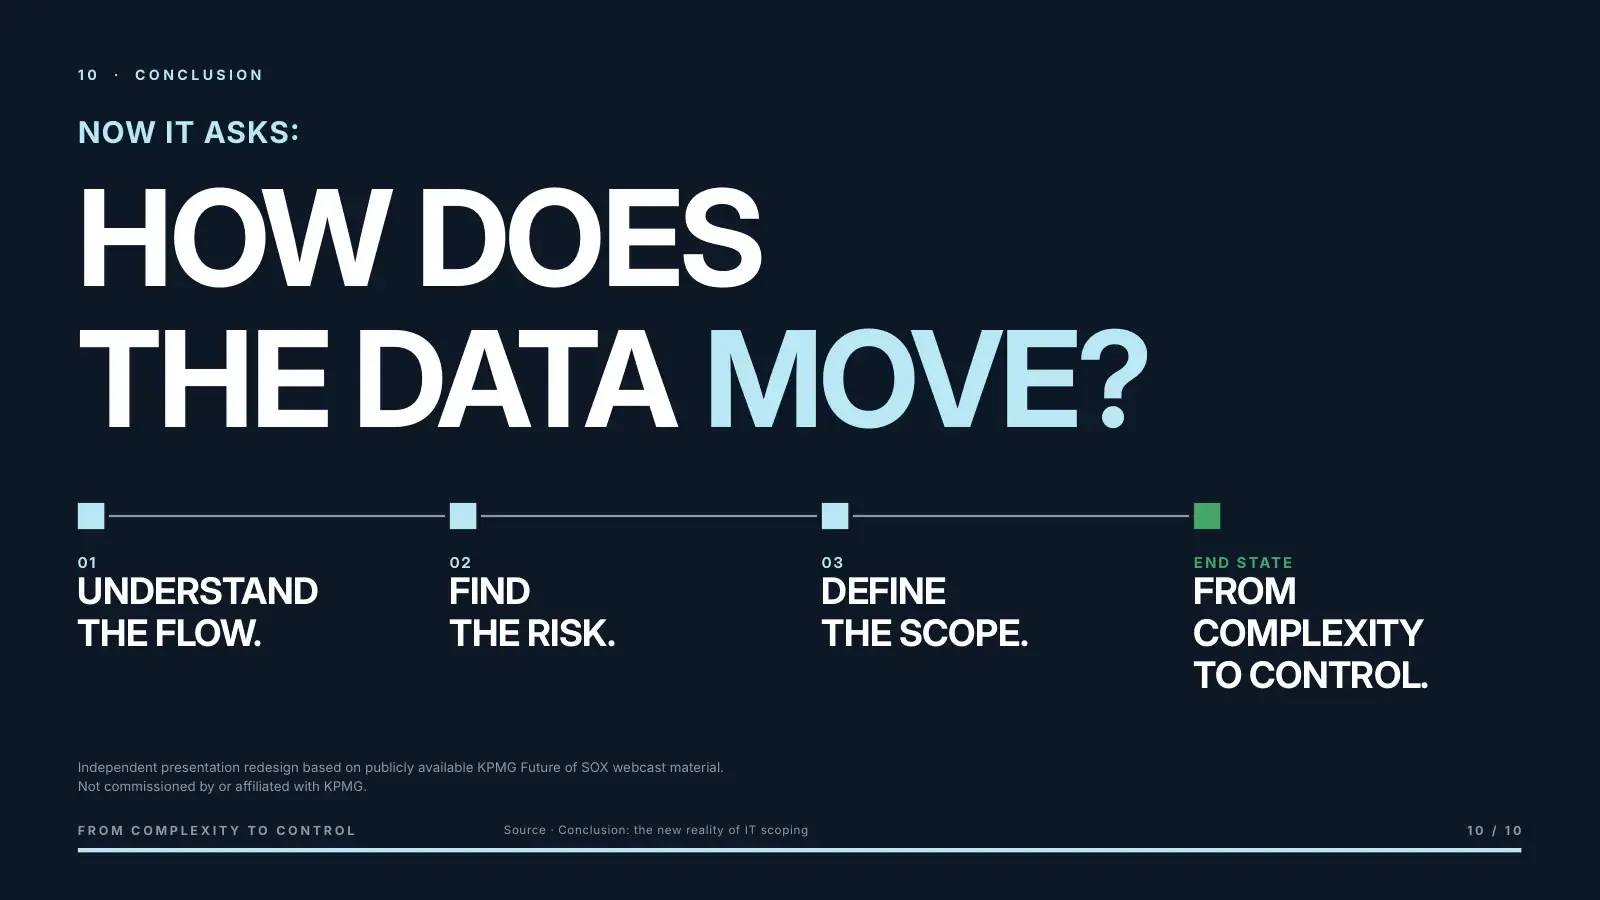
  13. 10 state B, how does the data move10 B · How does the data move? Morph

Built in
PowerPoint.

The redesign stays editable, reusable and presentation-ready.

  • 5slide layouts
  • 1theme: colours + fonts
  • 12Morph transitions
  • 134animation effects
  • 480+native, named objects
  • 0images. Every diagram is shapes
Master

One slide master, five intentional layouts: Cover, Statement left, Statement full width, Thesis and Closing. Kicker, headline and footer live in the layouts, not on each slide.

Grid
Slide 04 with the deck's alignment guides overlaid

Saved guides at 0.65 in margins, centre lines and a footer baseline. Stations, risk points and controls are distributed on fixed steps.

Morph
Black box state and visible system state alternating

Objects share names across slides, like !!System B and !!B Origin, so Morph tracks each one. The progress bar is one Morph object that grows across the whole deck.

Shapes
Selection · Slide 06
  • Decision / Controlled mark
  • Decision / Note
  • Decision
  • Test 4 / Reason
  • Test 4 / Answer
  • !!Q4
  • !!Row4
  • Bypass / Privileged access path
  • Dependency / Highlight
  • Chain / Financial Control
  • Chain / ERP
  • Chain / Identity System
  • Headline

Every object is native and named for the Selection pane, grouped by role. Anyone can find, edit or re-time a part of the diagram.

Motion
  • 025 clicks · radial build
  • 038 clicks · wipe + motion path
  • 044 clicks · data token path
  • 056 clicks · one test each
  • 065 clicks · reasoning reveal
  • 082 clicks · journey + highlight
  • 104 clicks · the route

Wipe, Fade, Appear and Motion Paths only. Every build has a reason: a signal travels, a risk appears, a decision lands.

Theme
FROM COMPLEXITYAptos Display · Bold · headingsAptos · body, labels and numbers

Colours and fonts are theme tokens. Blue carries logic, violet marks technology layers, green appears only in a controlled state.

Built inPowerPoint.Not limitedby it.

Storytelling · Information Design · Native Motion · Editable Systems

Independent presentation redesign based on publicly available KPMG Future of SOX webcast material. Not commissioned by or affiliated with KPMG. The PDF preview shows slides in their final build state; open the PPTX in PowerPoint to see Morph and animation.

Next in the series · 02 AI, Prioritized → ← All work