


← Khanim AzimliPowerPoint, Rebuilt · 03

PowerPoint,
rebuilt.

Different industries. Different content. The same transformation skill: dense business material rebuilt as native, editable PowerPoint.

Compliance·Banking AI·Life sciences
PowerPoint Transformation 03
40
SOURCE SLIDES
→
10
SLIDES OF DIAGNOSIS

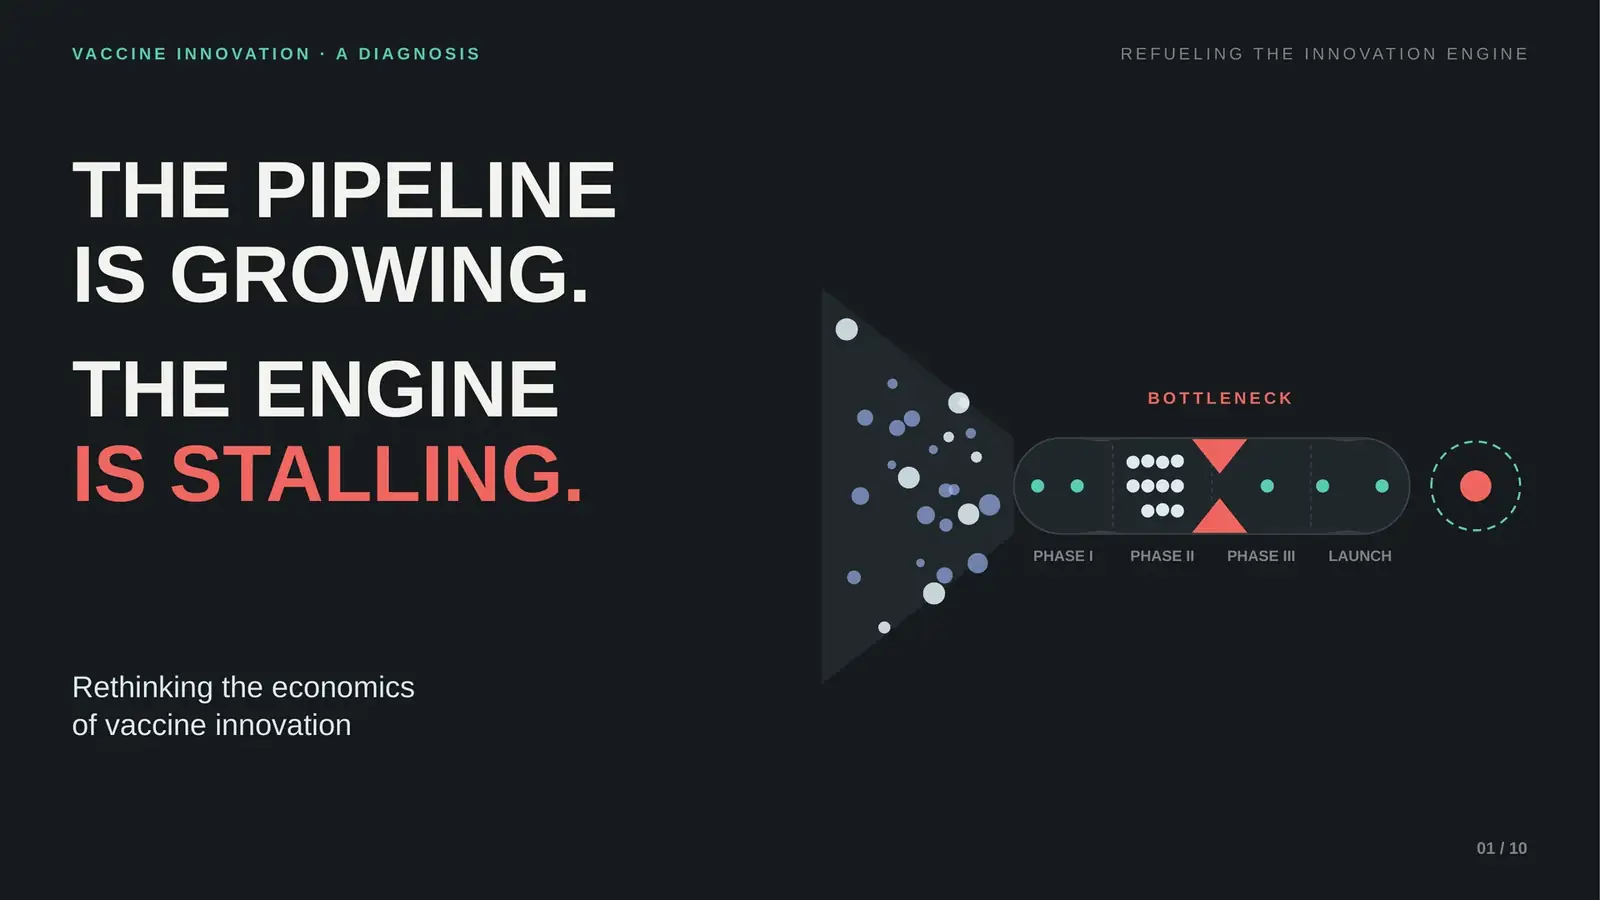
The pipeline
is growing.The engine
is stalling.

The source contained the evidence.
The redesign had to reveal the contradiction.

HealthcareVaccine InnovationStrategic StorytellingPowerPoint Redesign

A dense vaccine-innovation discussion reframed as a 10-slide visual diagnosis.

The finished .pptx · cover, Morph frame 1 → 2Native shapes · no images

The charts
weren't the story.
The contradiction was.

This PowerPoint transformation reframes a 40-slide vaccine-innovation discussion into a focused 10-slide narrative.

The source contained strong data on unmet need, pipeline growth, sales, development economics, technical difficulty and commercial pressure.

Instead of treating each chart as a separate finding, the redesign builds one visual system around the innovation engine:

  • 01how it grows,
  • 02where it stalls,
  • 03and what needs to change.

The result is a presentation that behaves like a diagnosis, not a report summary.

Project

PowerPoint Transformation 03
Healthcare · Vaccine Innovation

Role
  • Narrative Restructuring
  • Presentation Design
  • Data Storytelling
  • Information Design
  • PowerPoint Motion
  • Editable Visual Systems
Format

10-slide PowerPoint redesign
16 Morph frames · .pptx

40 slides of evidence.
10 slides of argument.

Before · source structure
  • Dense analytical content
  • Traditional charts
  • Frameworks
  • Tables
  • Multiple findings per slide
After · the redesign
  • One narrative
  • One visual system
  • One contradiction
  • One conclusion

Same data.
A sharper diagnosis.

Seven transformations. Drag each divider: the left side is a simplified, anonymised drawing of the source structure; the right side is the slide from the finished PowerPoint.

01

TABLEHUMAN-SCALE INSIGHT

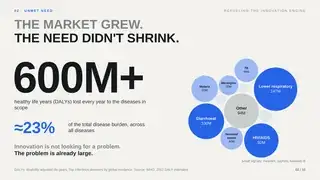
THE MARKET GREW. THE NEED DIDN'T SHRINK.

A dense disease-burden dataset becomes one dominant number and one clear message: 600M+ healthy life years lost every year, close to a quarter of the total disease burden.
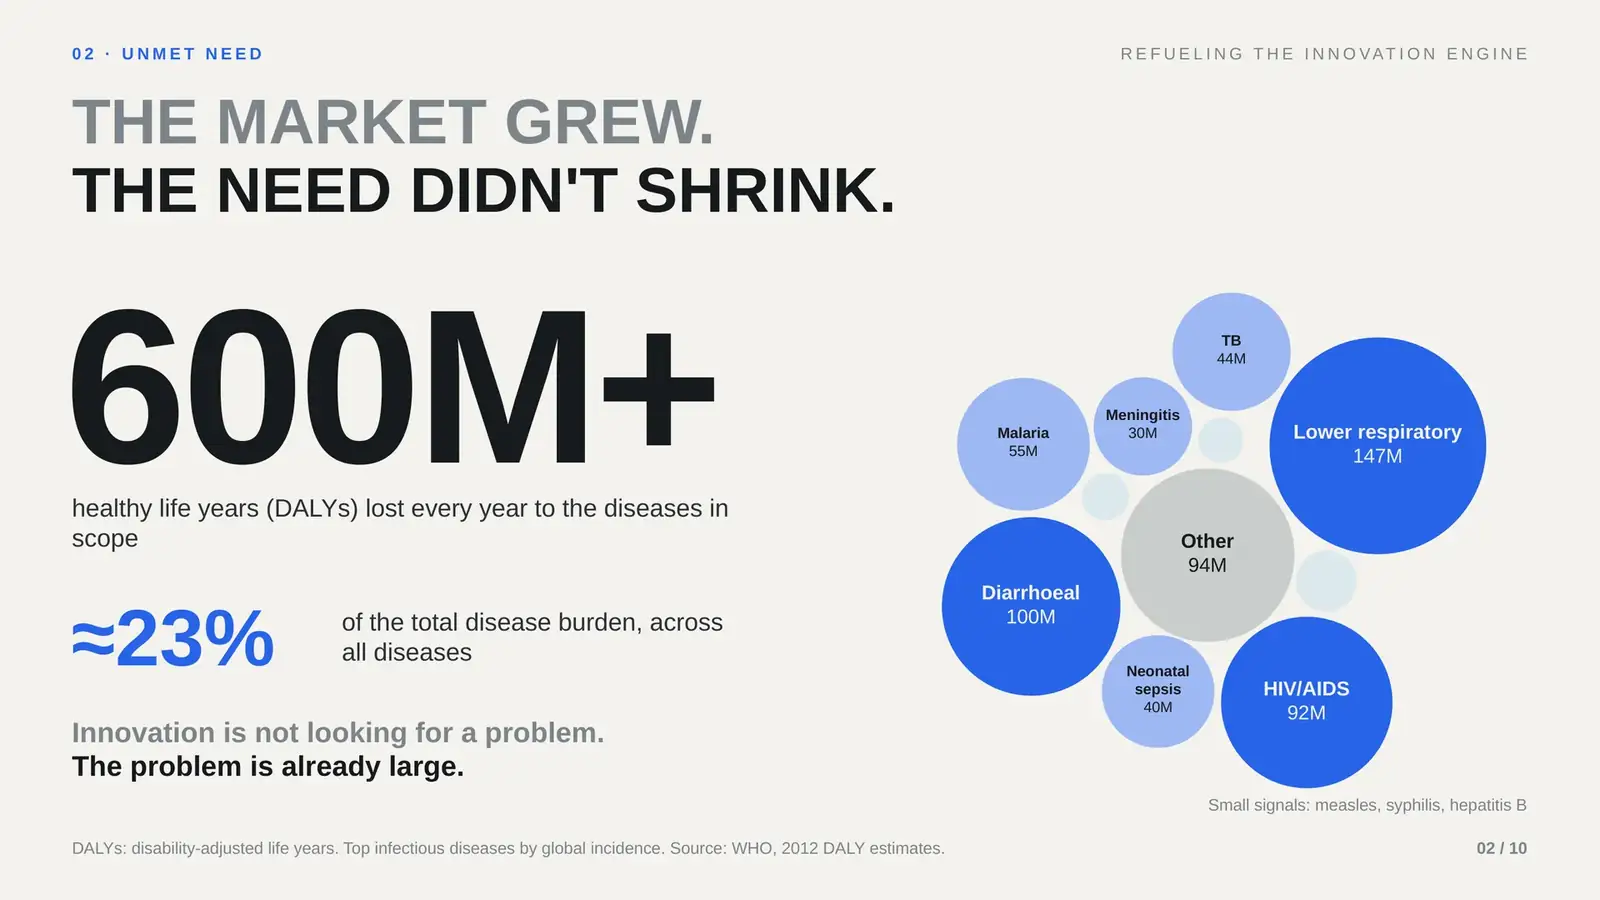
Redesigned slide: The Market Grew. The Need Didn'T Shrink.
BEFORE · SOURCE STRUCTUREAFTER · REDESIGN

Source structure: Large disease-burden table, redrawn without its textSlide from the finished .pptx
02

TRENDTENSION

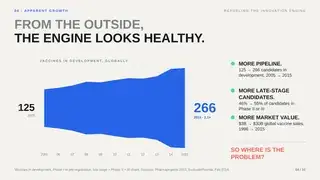
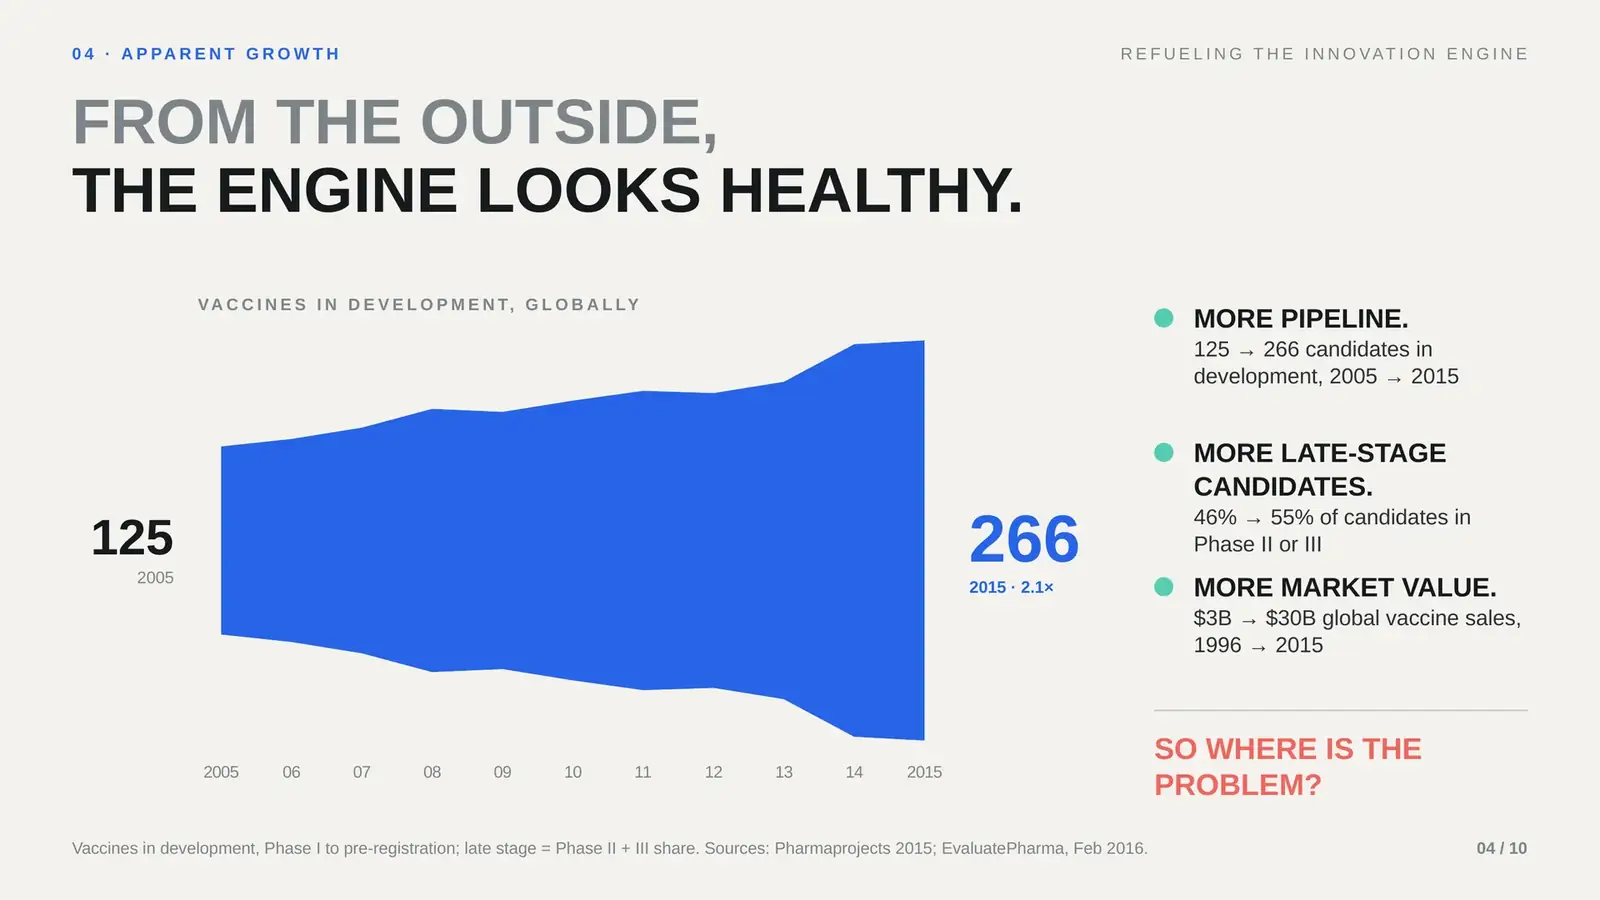
FROM THE OUTSIDE, THE ENGINE LOOKS HEALTHY.

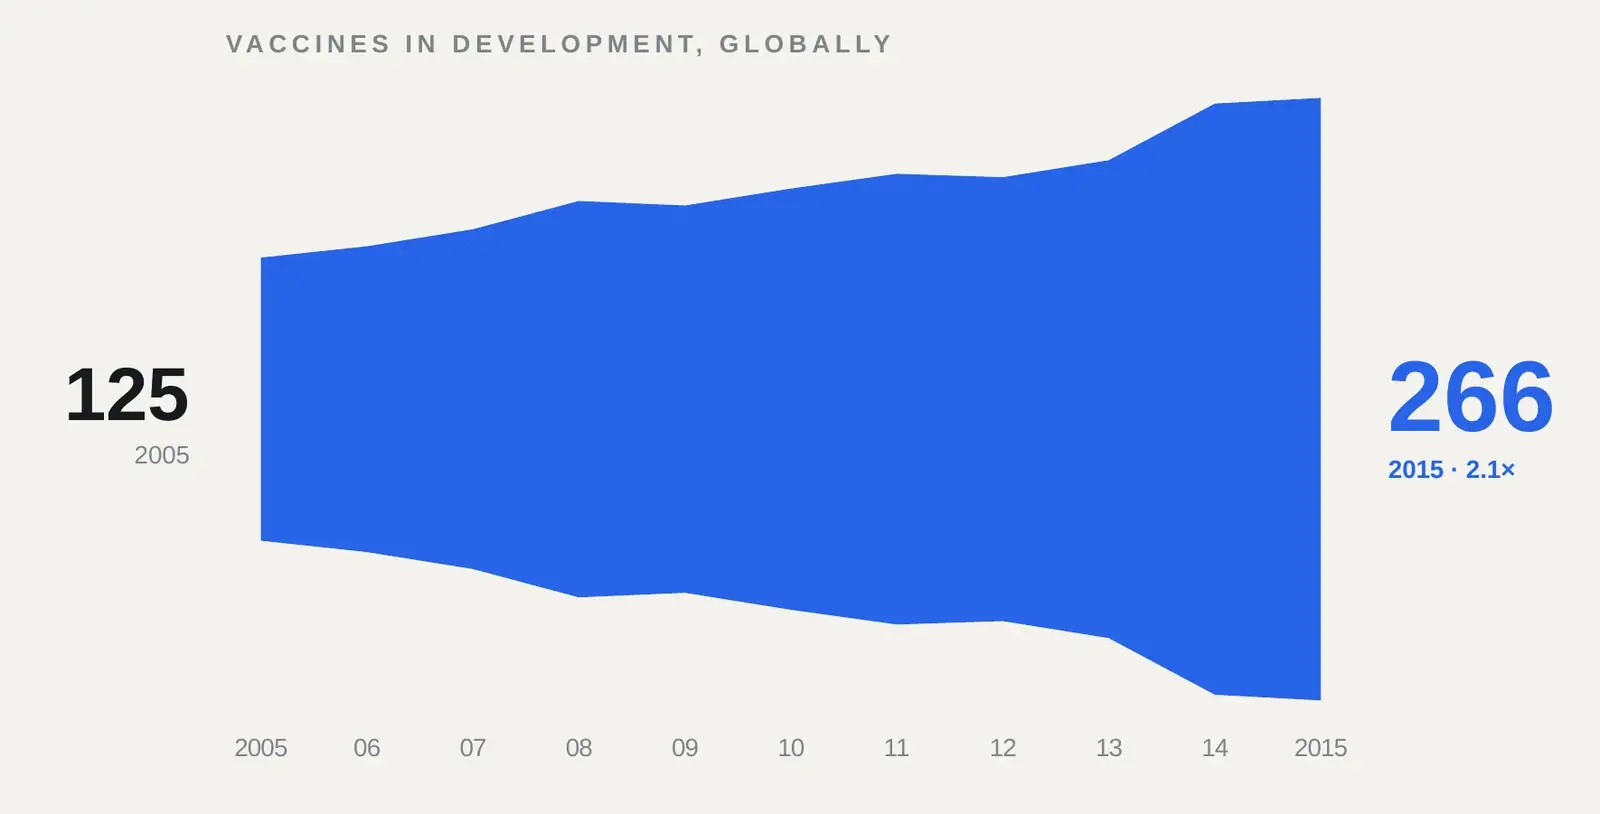
The data is no longer shown only as growth. 125 → 266 candidates becomes the setup for the contradiction, and the slide ends on a question: so where is the problem?

Redesigned slide: From The Outside, The Engine Looks Healthy.
BEFORE · SOURCE STRUCTUREAFTER · REDESIGN

Source structure: Traditional pipeline-growth chart, redrawn without its textSlide from the finished .pptx

More sales
doesn't mean
more breakthroughs.

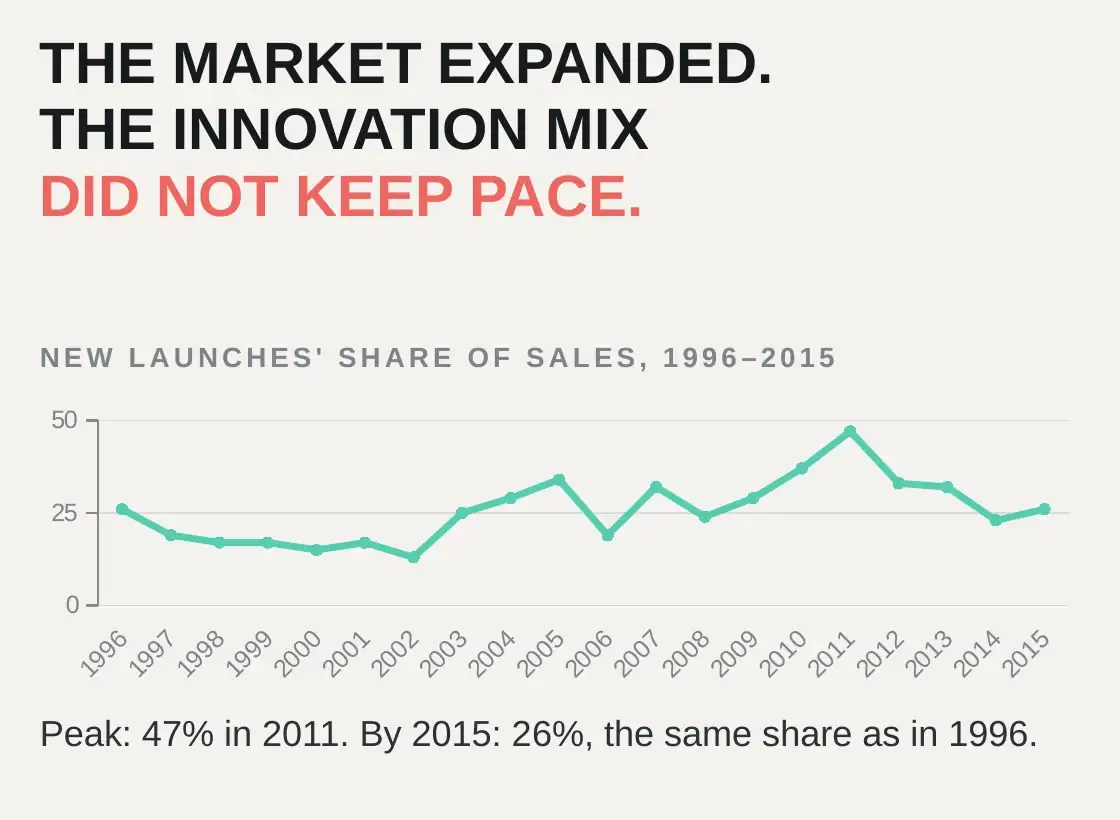
The contradiction at the centre of the deck. Two charts that lived pages apart in the source now share one picture, and the picture disagrees with itself.

03

TWO CHARTSONE CONTRADICTION

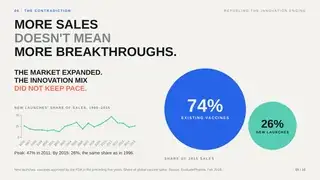
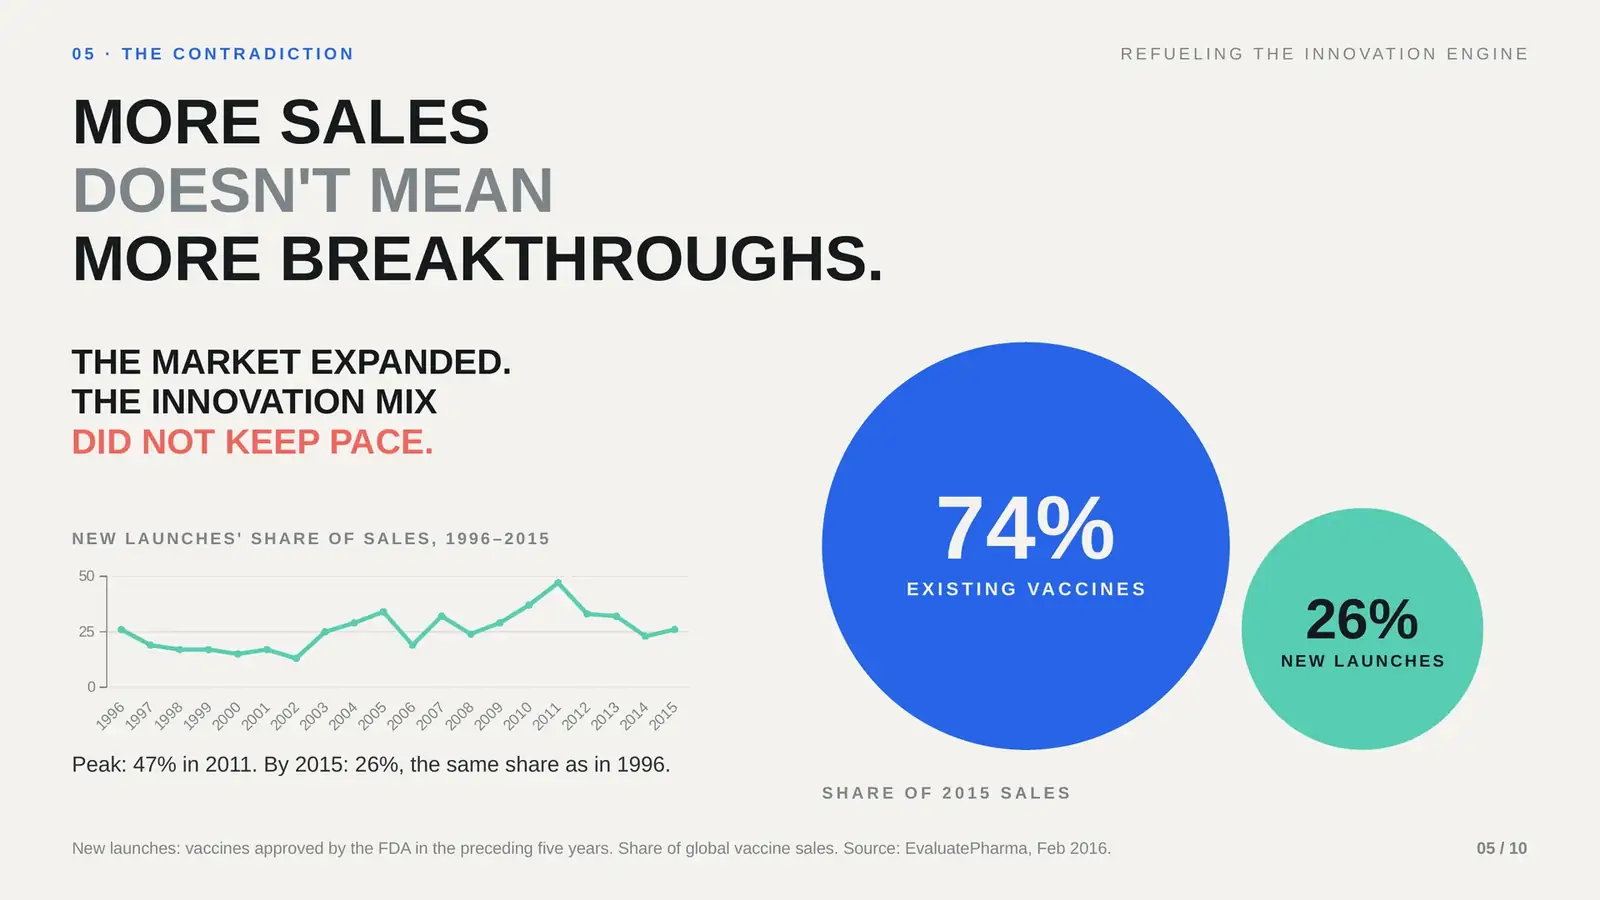
MORE SALES DOESN'T MEAN MORE BREAKTHROUGHS.

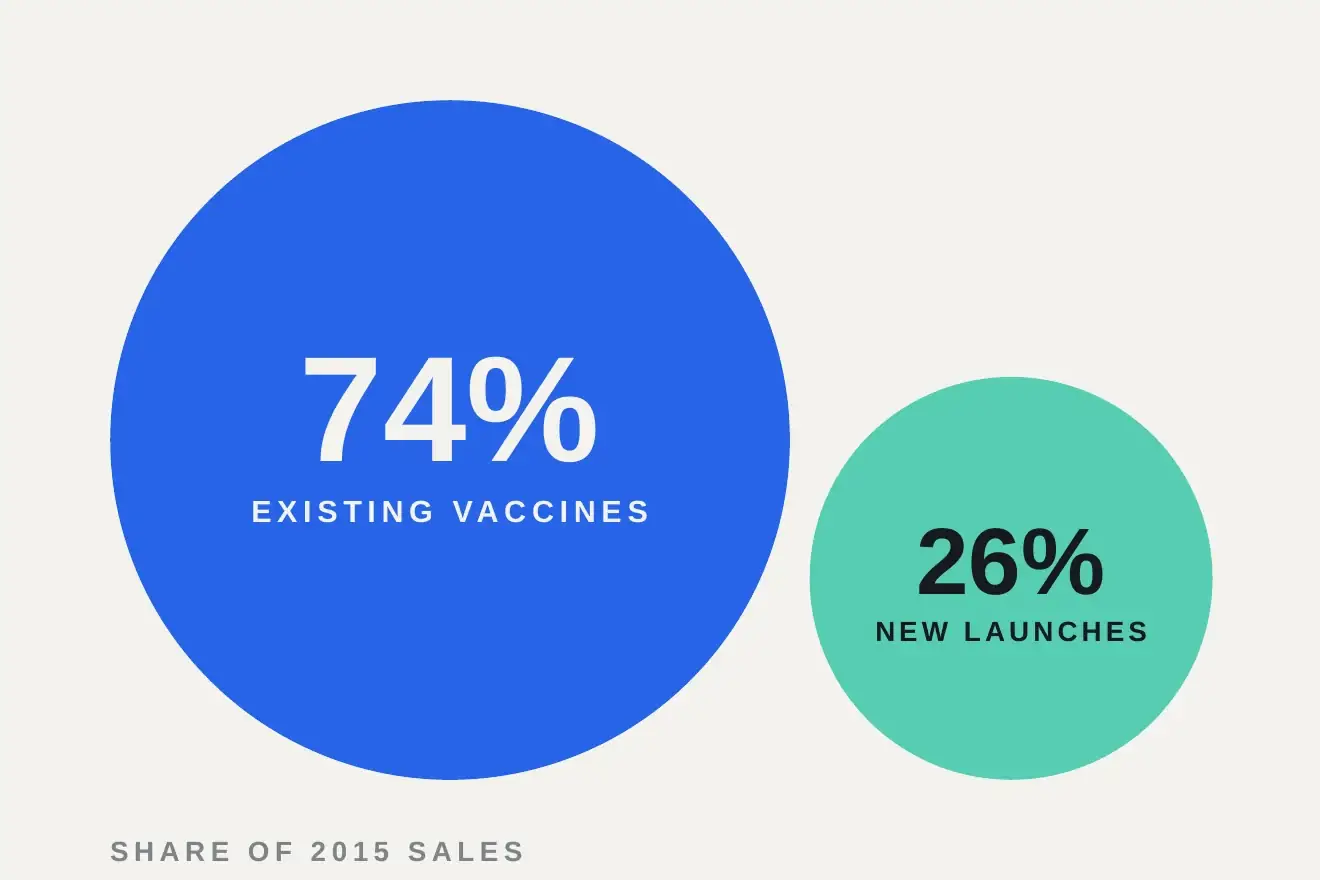
The market circle splits by area: 74% of sales from existing vaccines, 26% from new launches. Growth and innovation finally appear on the same picture, and they disagree.

Redesigned slide: More Sales Doesn'T Mean More Breakthroughs.
BEFORE · SOURCE STRUCTUREAFTER · REDESIGN

Source structure: Sales growth and launch share, shown separately, redrawn without its textSlide from the finished .pptx
Morph frame A: the $30B market circle
Morph frame A · the market grew tenfold
Morph frame B: the same circle split into 74% existing and 26% new
Morph frame B · the same circle, split by what it is made of
Close crop: 74% existing vaccines, 26% new launches
Close crop: the market expanded, the innovation mix did not keep pace, with the editable launch-share line chart
04

THREE SERIESONE SYSTEM

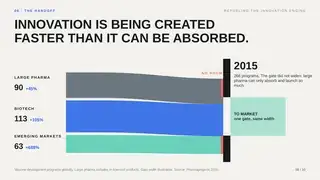
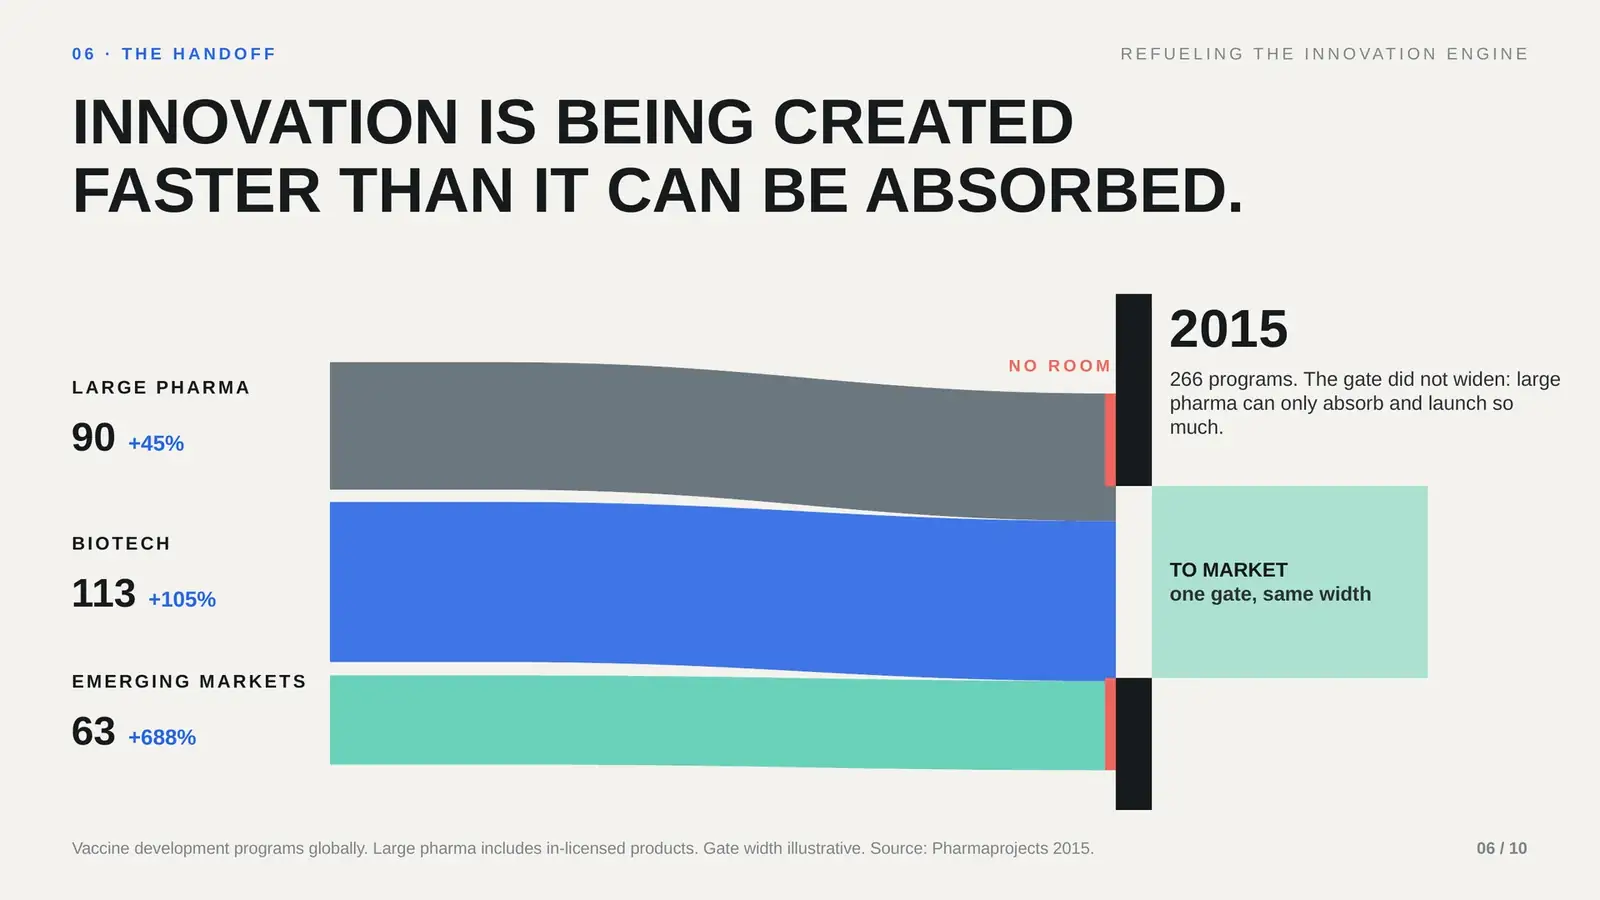
INNOVATION IS BEING CREATED FASTER THAN IT CAN BE ABSORBED.

Growth in biotech and emerging-market programs becomes visually meaningful only when compared with a fixed commercialisation gate.

Redesigned slide: Innovation Is Being Created Faster Than It Can Be Absorbed.
BEFORE · SOURCE STRUCTUREAFTER · REDESIGN

Source structure: Three company-type pipeline series, redrawn without its textSlide from the finished .pptx
05

FRAMEWORKVISUAL ARGUMENT

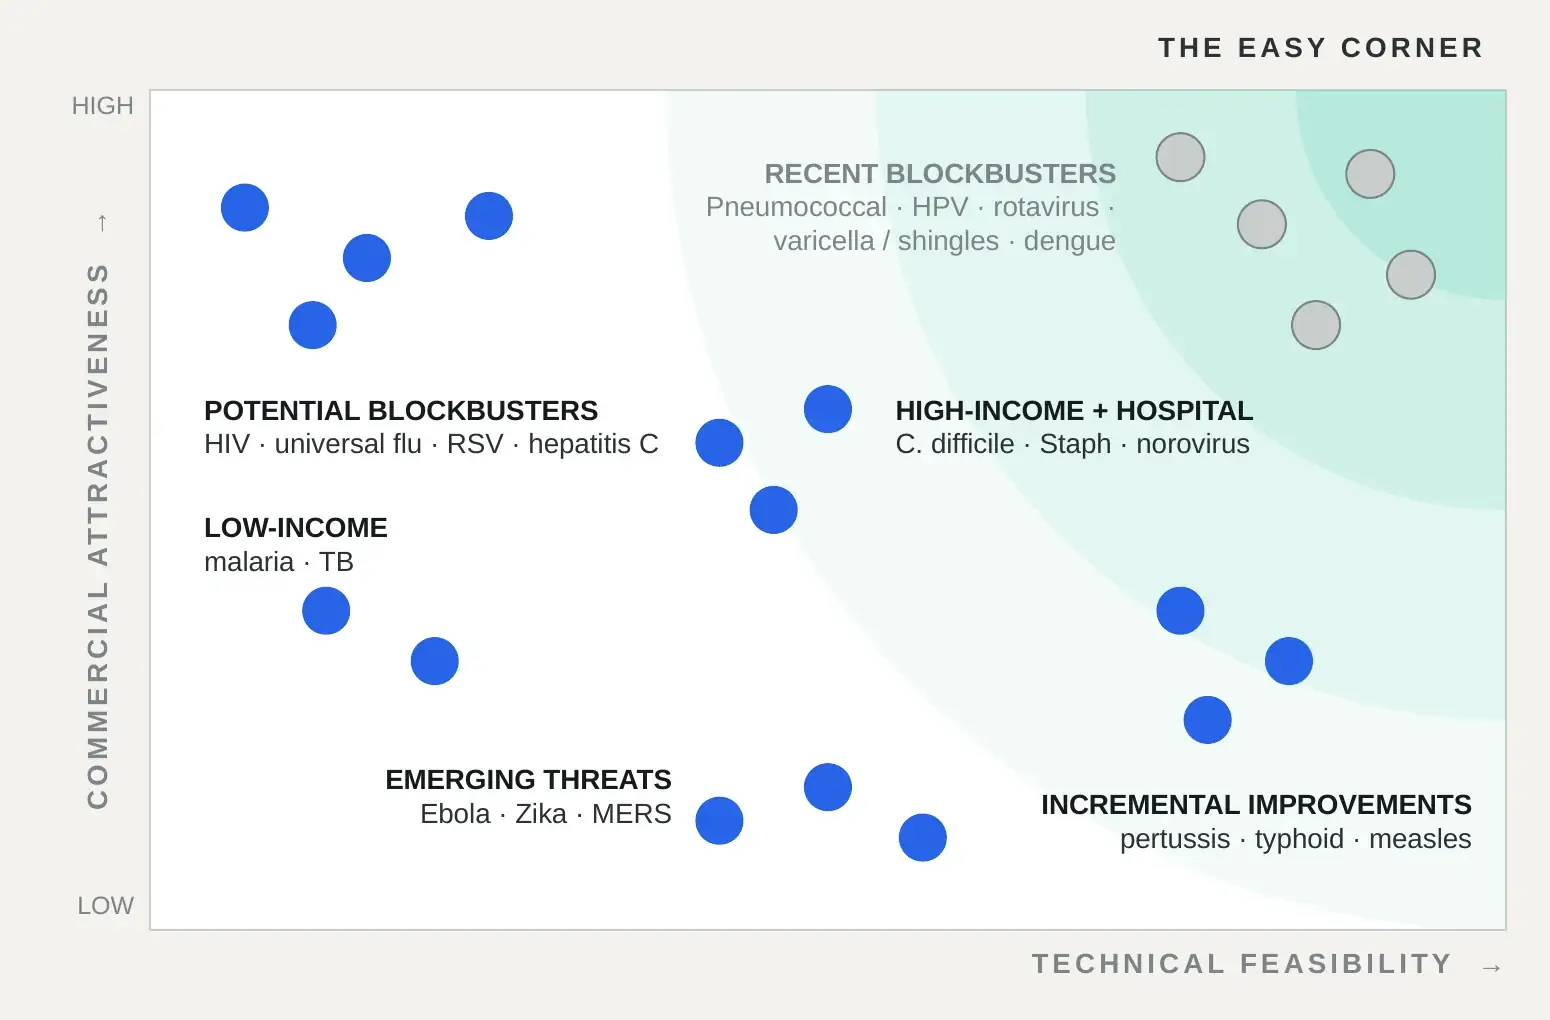
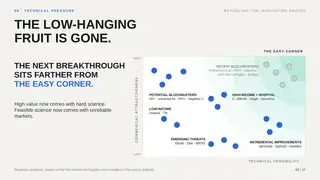
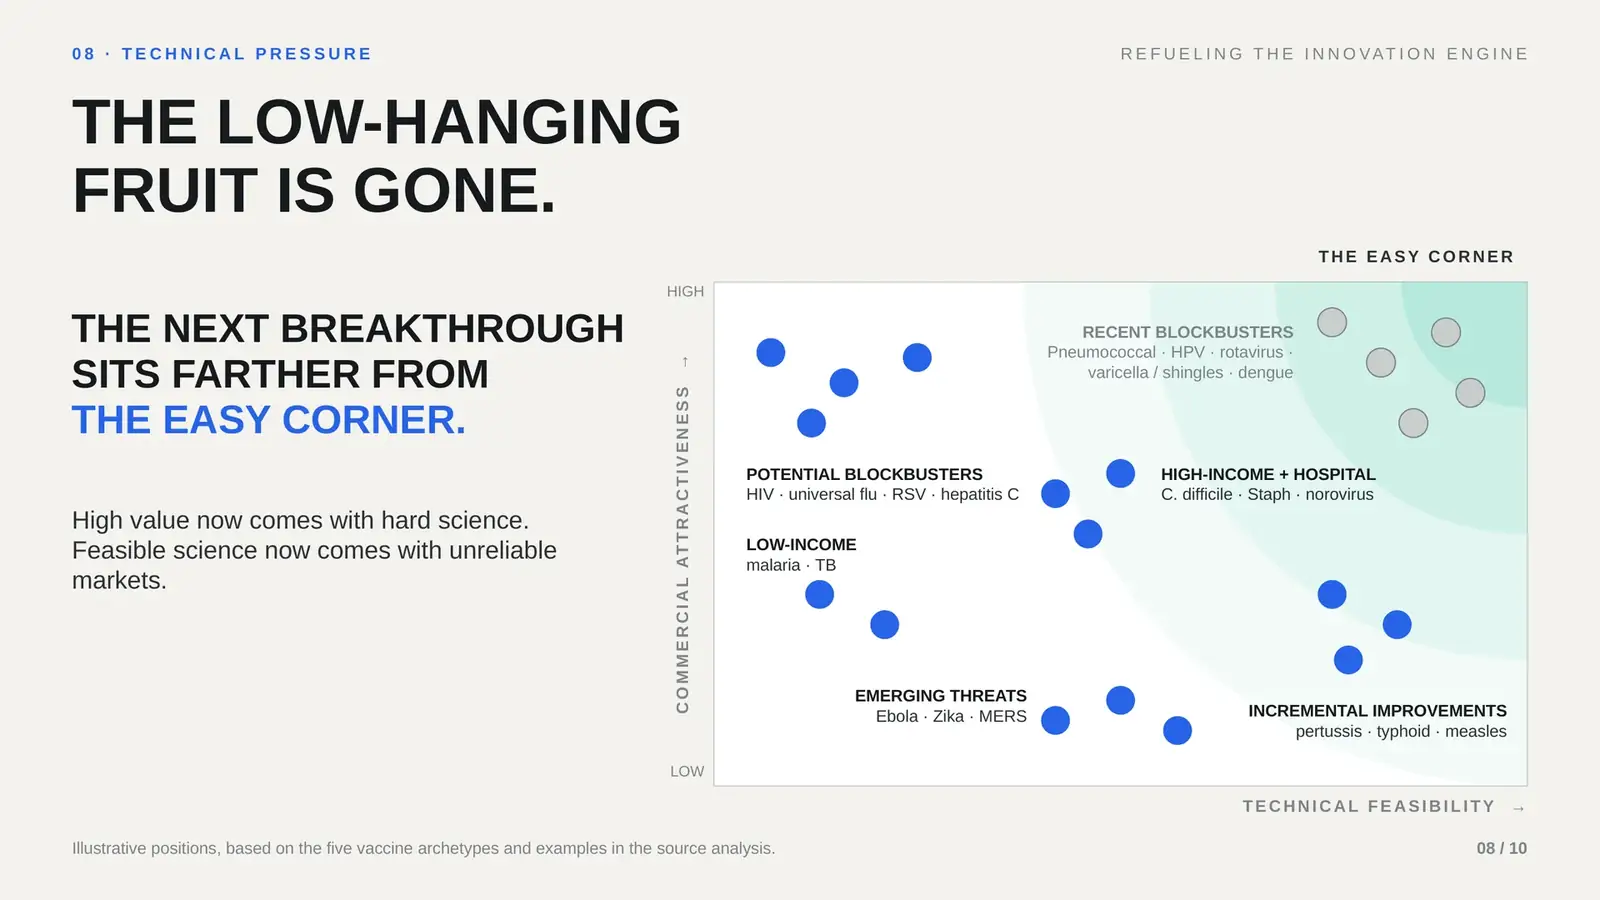
THE LOW-HANGING FRUIT IS GONE.

The point is not to reproduce a quadrant. It is to show that the next opportunities sit farther from the easy corner.

Redesigned slide: The Low-Hanging Fruit Is Gone.
BEFORE · SOURCE STRUCTUREAFTER · REDESIGN

Source structure: Attractiveness vs feasibility framework, redrawn without its textSlide from the finished .pptx
06

LISTMECHANISM

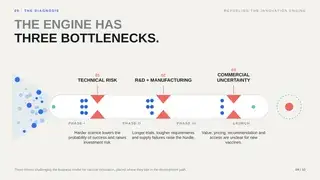
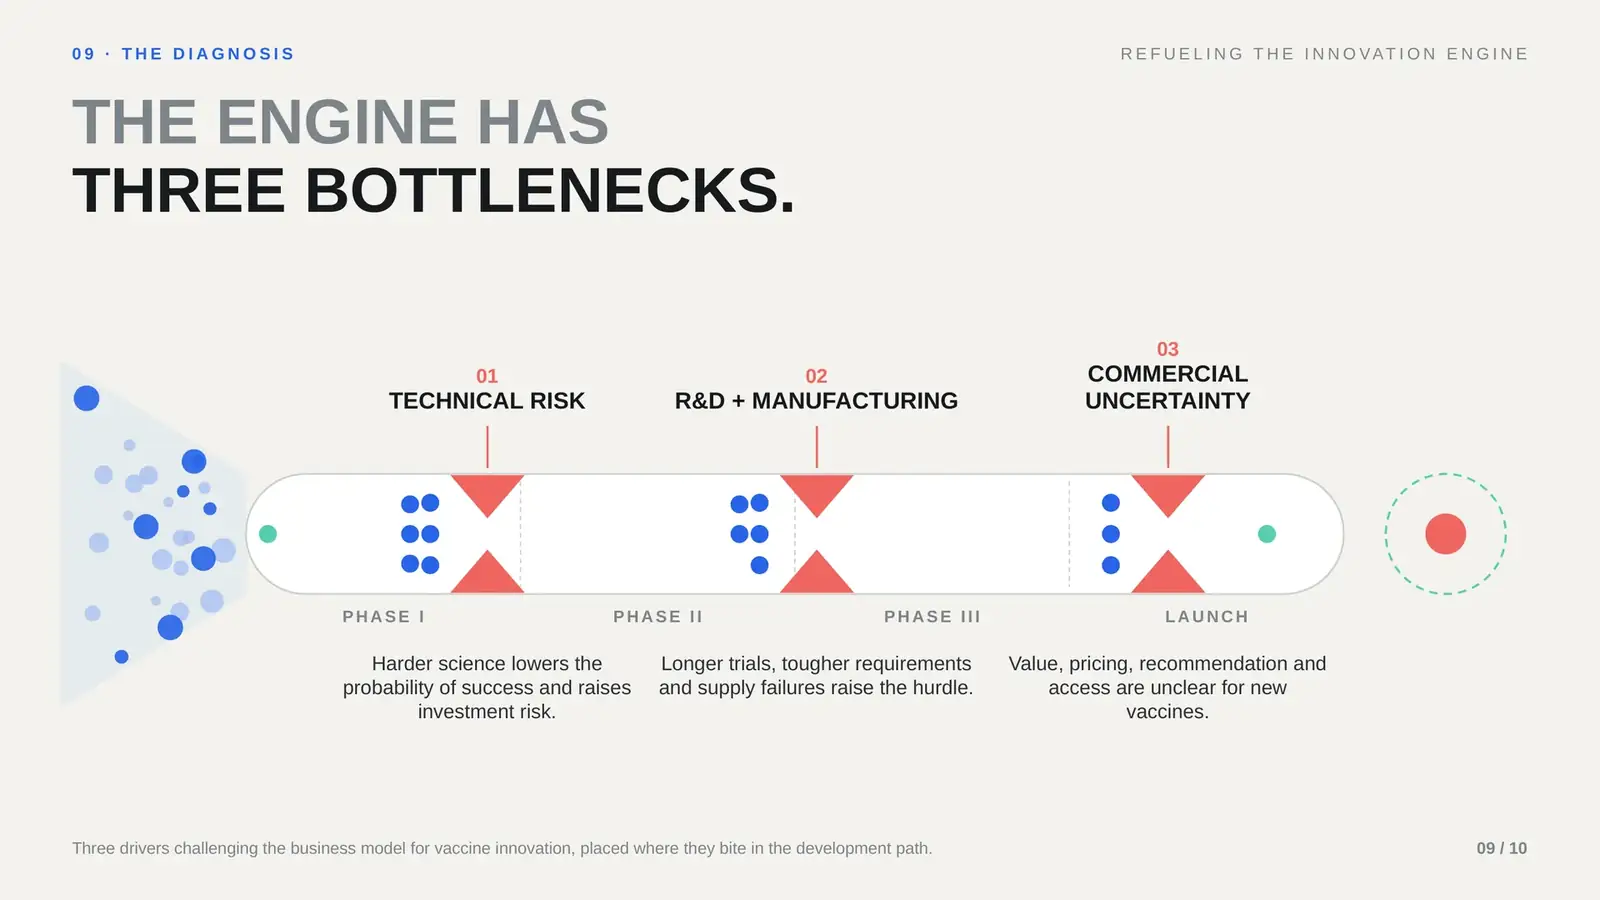
THE ENGINE HAS THREE BOTTLENECKS.

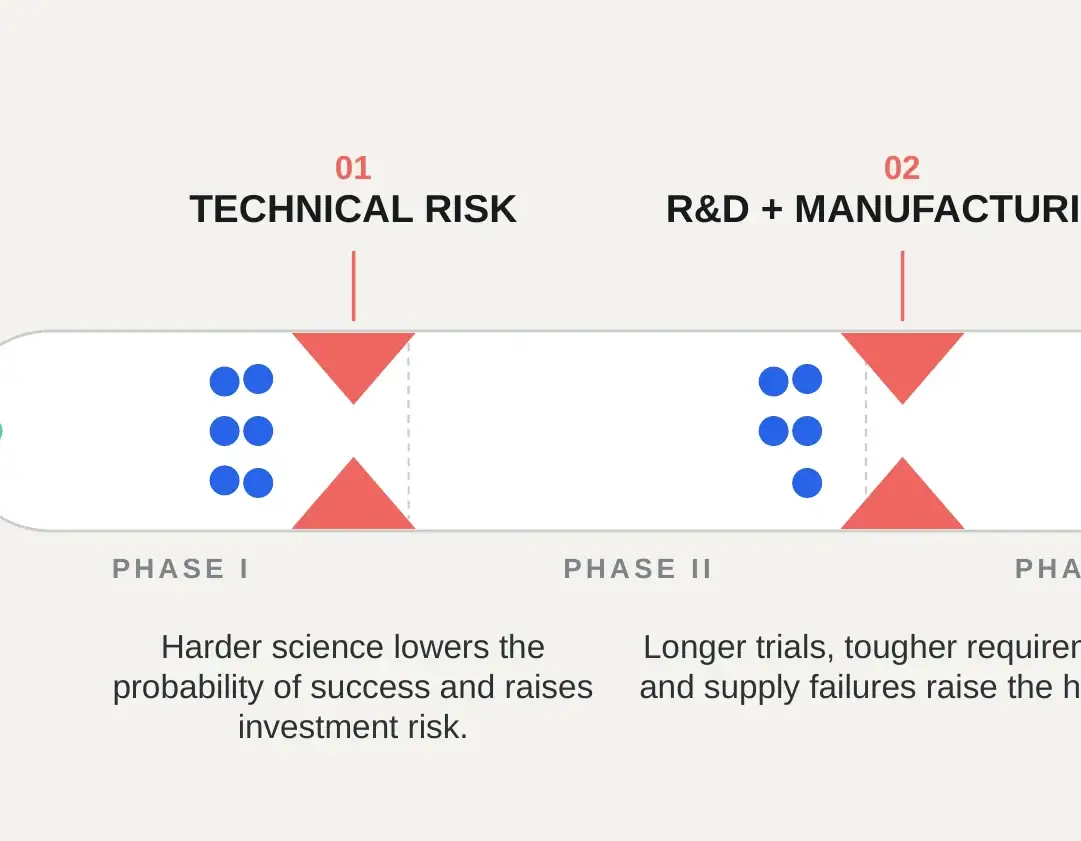
Technical risk, R&D + manufacturing and commercial uncertainty are placed exactly where they constrain the development pipeline.

Redesigned slide: The Engine Has Three Bottlenecks.
BEFORE · SOURCE STRUCTUREAFTER · REDESIGN

Source structure: Three pressure drivers, explained separately, redrawn without its textSlide from the finished .pptx
07

RECOMMENDATIONSSYSTEM RELEASE

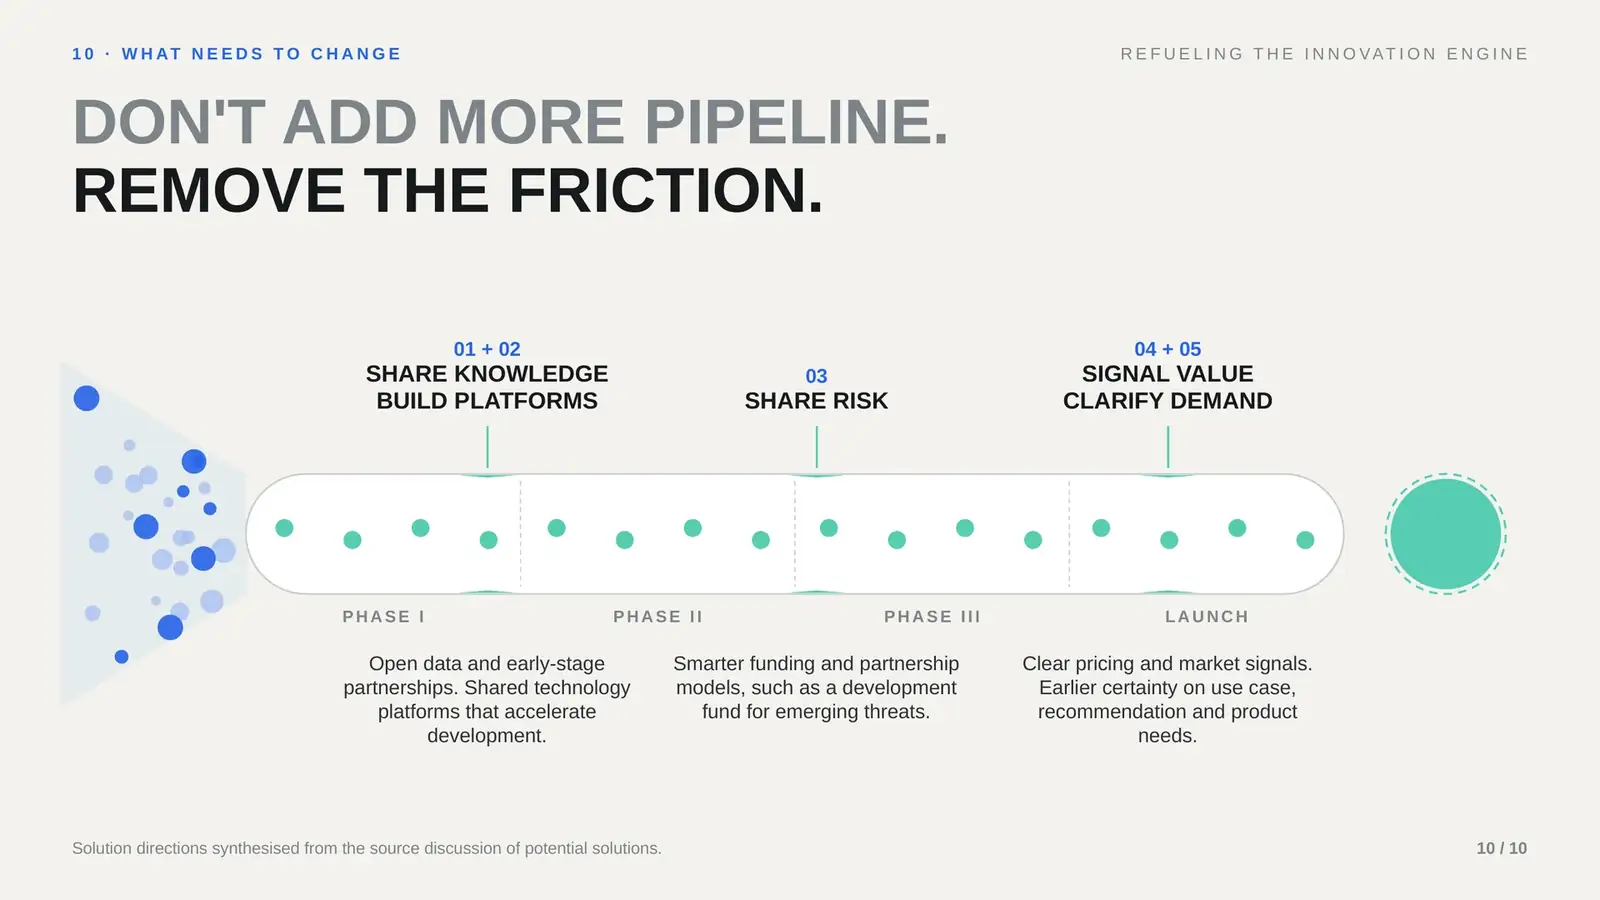
DON'T ADD MORE PIPELINE. REMOVE THE FRICTION.

The same pipeline from the cover is reused, but now the bottlenecks are opened. Each lever sits where its bottleneck was: narrative continuity across the whole deck.

Redesigned slide: Don'T Add More Pipeline. Remove The Friction.
BEFORE · SOURCE STRUCTUREAFTER · REDESIGN

Source structure: Potential solutions listed as recommendations, redrawn without its textSlide from the finished .pptx
One visual system.
Ten slides.

The strongest design decision in the project: every finding is told as a state of the same innovation engine. The cover sets it running, the middle of the deck strains it, and the close sets it running again.

  1. 01
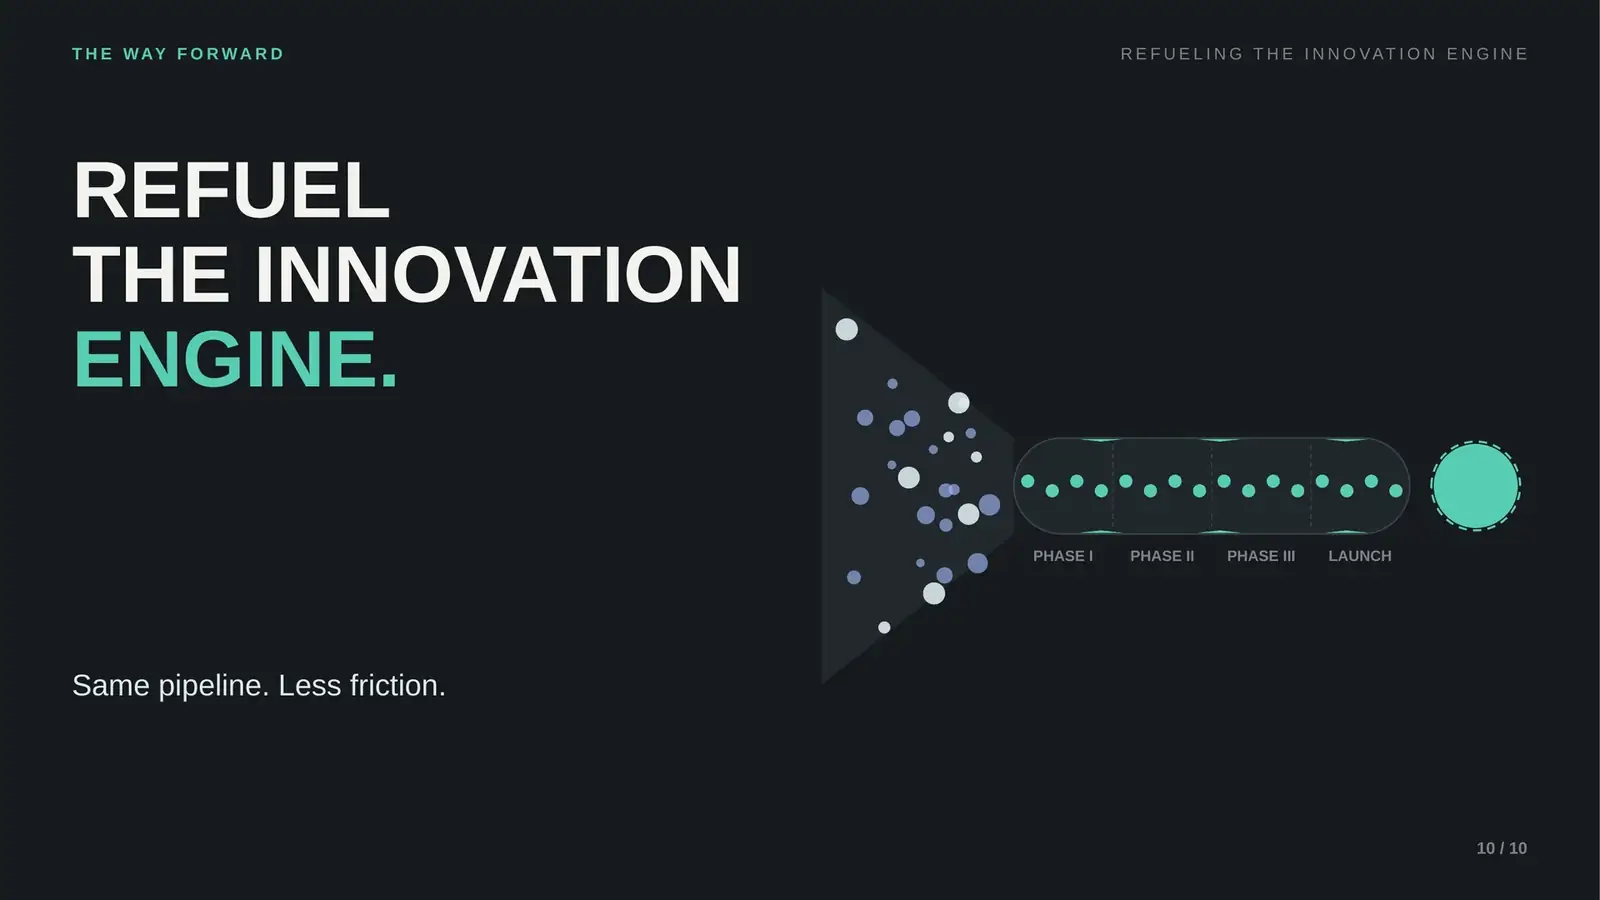
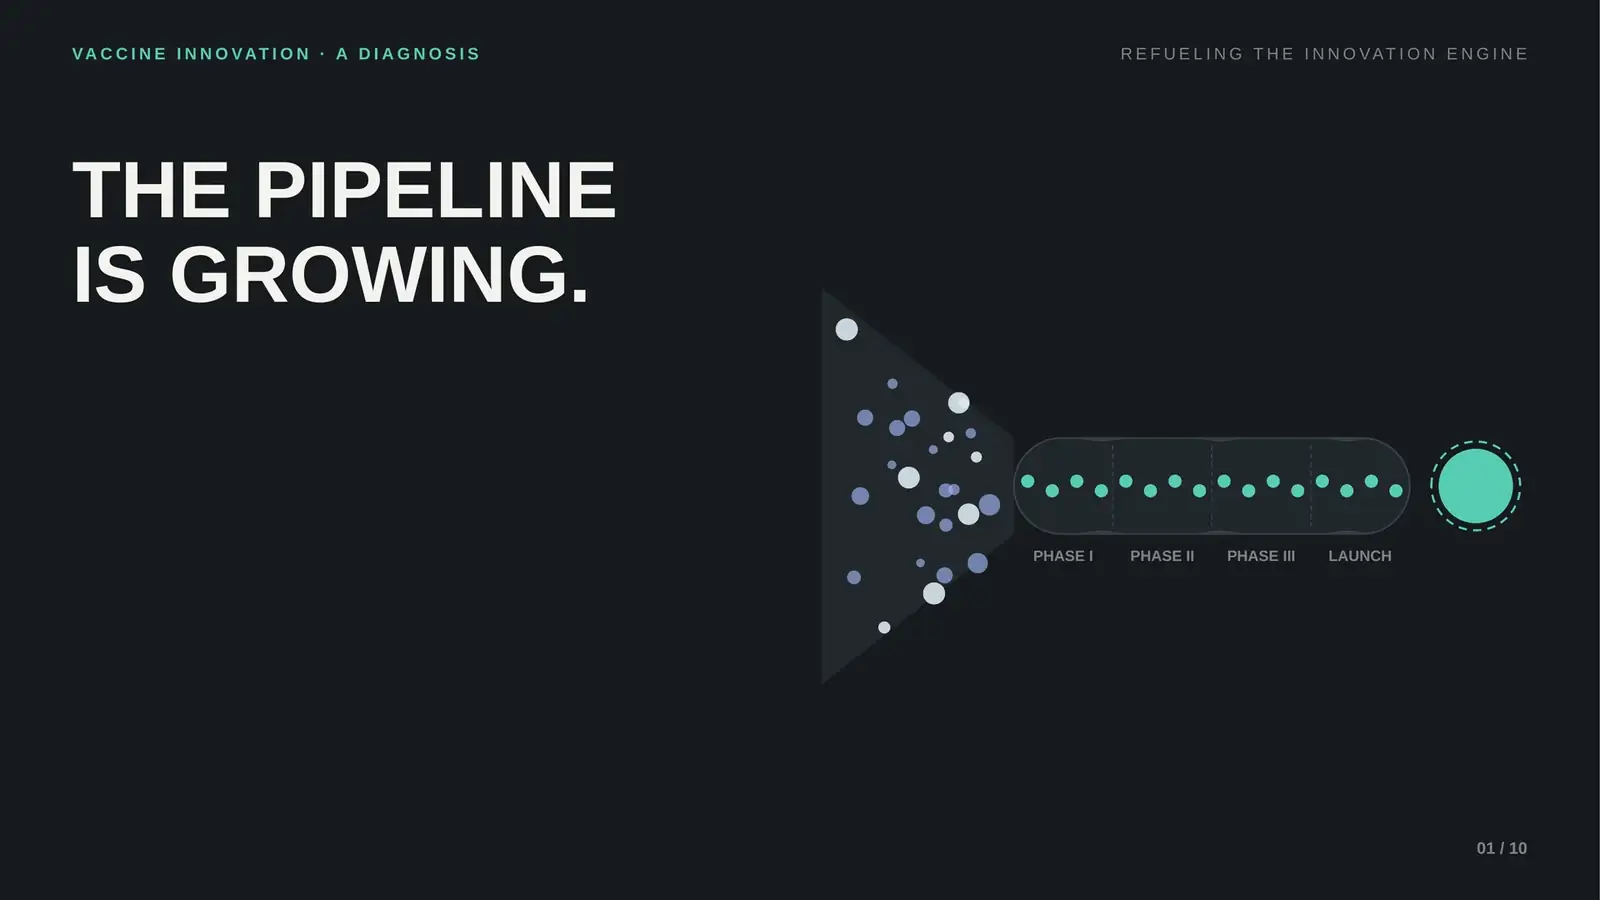
    COVER: Healthy flow
    COVERHealthy flow

    Research feeds a pipeline. A steady stream comes out the other side.

  2. 02
    CONTRADICTION: Growth without enough breakthroughs
    CONTRADICTIONGrowth without enough breakthroughs

    The market expands. The share from new vaccines does not.

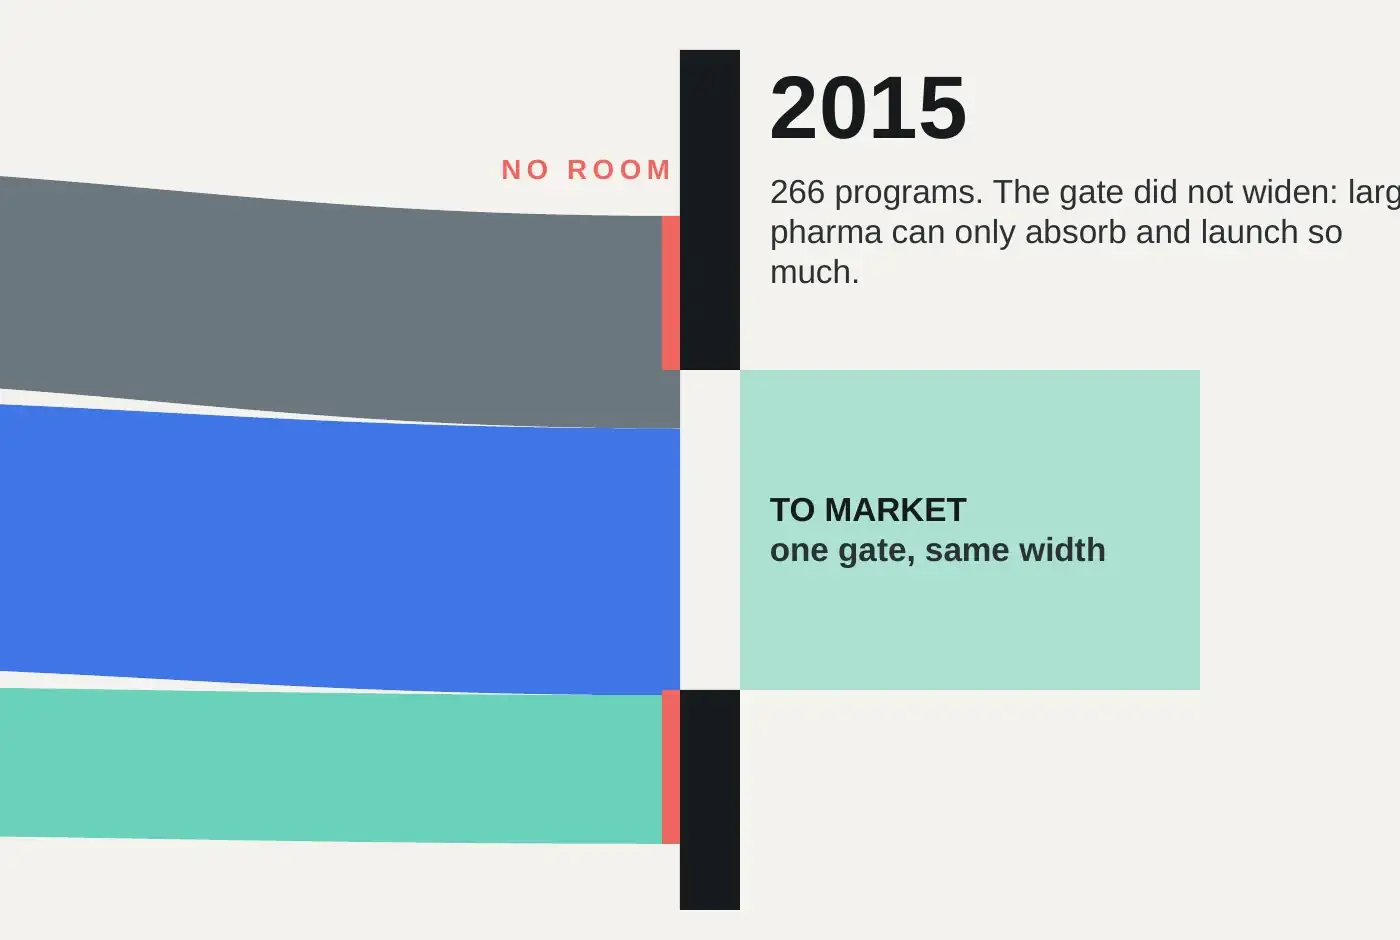
  3. 03
    HANDOFF: Flow exceeds capacity
    HANDOFFFlow exceeds capacity

    Three sources widen against one gate that stays the same width.

  4. 04
    BOTTLENECKS: Friction appears
    BOTTLENECKSFriction appears

    The cover engine returns, now pinched in three places.

  5. 05
    SOLUTION: Friction is removed
    SOLUTIONFriction is removed

    The pinches release where they sat. Queues dissolve.

  6. 06
    FINALE: Engine runs again
    FINALEEngine runs again

    Back to the cover position, running clear.

What changed

Five decisions, each one a step from report to argument.

  1. DATAMany chartsone argument
  2. STRUCTUREMultiple findingsone diagnosis
  3. VISUAL LANGUAGECharts and frameworksone recurring engine metaphor
  4. MOTIONStaticprogressive explanation
  5. FORMATLong corporate presentation10-slide editable PowerPoint story

Built in
PowerPoint.

Close details from the finished .pptx. Every diagram, chart and layout on this page is a native PowerPoint object that can be opened, edited and presented.

01 · MASTER

LAB · Cover · Carbon
LAB · Content · Bone
LAB · Content · Carbon

Three named layouts with kicker, title, source and page placeholders. Theme colours and fonts live in the theme, so the deck restyles in one place.

02 · MORPH

Slide 09, bottlenecksSlide 10, bottlenecks released

Sixteen frames for ten slides. Objects share Morph names across frames, so the pinches retract, queues dissolve and the output grows, instead of one slide replacing another.

03 · EDITABLE CHARTS

Close crop: the pipeline stream, a native area chart
OffsetPipeline200577.51250672.513507651500852.51750954.517110471861140.519912421961334.5211149.526120157266

The widening stream is a native stacked area chart. An invisible offset series centres it, so the data sheet still holds the real values: 125 → 266.

04 · NATIVE SHAPES

SELECTION · SLIDE 0973 OBJECTS
!!eng-funnelfreeform
!!eng-piperounded rect
!!eng-pt-0 · !!eng-pb-0bottleneck 01
!!eng-pt-1 · !!eng-pb-1bottleneck 02
!!eng-pt-2 · !!eng-pb-2bottleneck 03
!!eng-p-0 … !!eng-p-1516 candidates
!!eng-ring · !!eng-outcapacity · output

Engine, flows, gate, field and bubbles are shapes and freeform curves. 400+ editable objects across the ten slides. No images.

05 · GRID

Slide 08 with its layout margins shown

0.6 inch margins, one headline position, one source line and one page counter on every content slide. The variety lives inside the grid.

06 · MOTION

ANIMATION · SLIDE 093 CLICKS
1 · Wipe ↓ ↑bottleneck 01 · technical risk
   Fadelabel + description
2 · Wipe ↓ ↑bottleneck 02 · R&D + manufacturing
   Fadelabel + description
3 · Wipe ↓ ↑bottleneck 03 · commercial
Slide 10 · Motion path ∞the engine flows again

Fade, Wipe and Appear only where they pace the argument. Looping motion paths keep the engine moving on the cover and the close.

07 · DIAGRAMS

Close crop: three flows into one fixed gateClose crop: two bottlenecks pinching the pipelineClose crop: the opportunity field and the easy corner

The gate, the bottlenecks and the opportunity field are drawn, not pasted: each one can be resized, recoloured or re-sequenced in PowerPoint.

The design
isn't flattened.
The thinking
stays editable.

The key diagrams, data visualisations and layouts remain presentation-ready and editable.

Built in PowerPoint. Not limited by it.

Refuel
the innovation
engine.

Same pipeline.
Less friction.

PowerPoint Transformation Study

Closing slide: refuel the innovation engine, with the engine running clear

Independent presentation redesign. The source document is confidential and is not reproduced: before views are simplified, anonymised drawings of its slide structures. Figures on the redesigned slides are attributed to the third-party sources cited on each slide. Not commissioned by or affiliated with the original authors.